Immigrants from St. Vincent and the Grenadines vs Immigrants from Western Asia Median Family Income
COMPARE
Immigrants from St. Vincent and the Grenadines
Immigrants from Western Asia
Median Family Income
Median Family Income Comparison
Immigrants from St. Vincent and the Grenadines
Immigrants from Western Asia
$90,094
MEDIAN FAMILY INCOME
0.2/ 100
METRIC RATING
275th/ 347
METRIC RANK
$108,691
MEDIAN FAMILY INCOME
95.6/ 100
METRIC RATING
111th/ 347
METRIC RANK
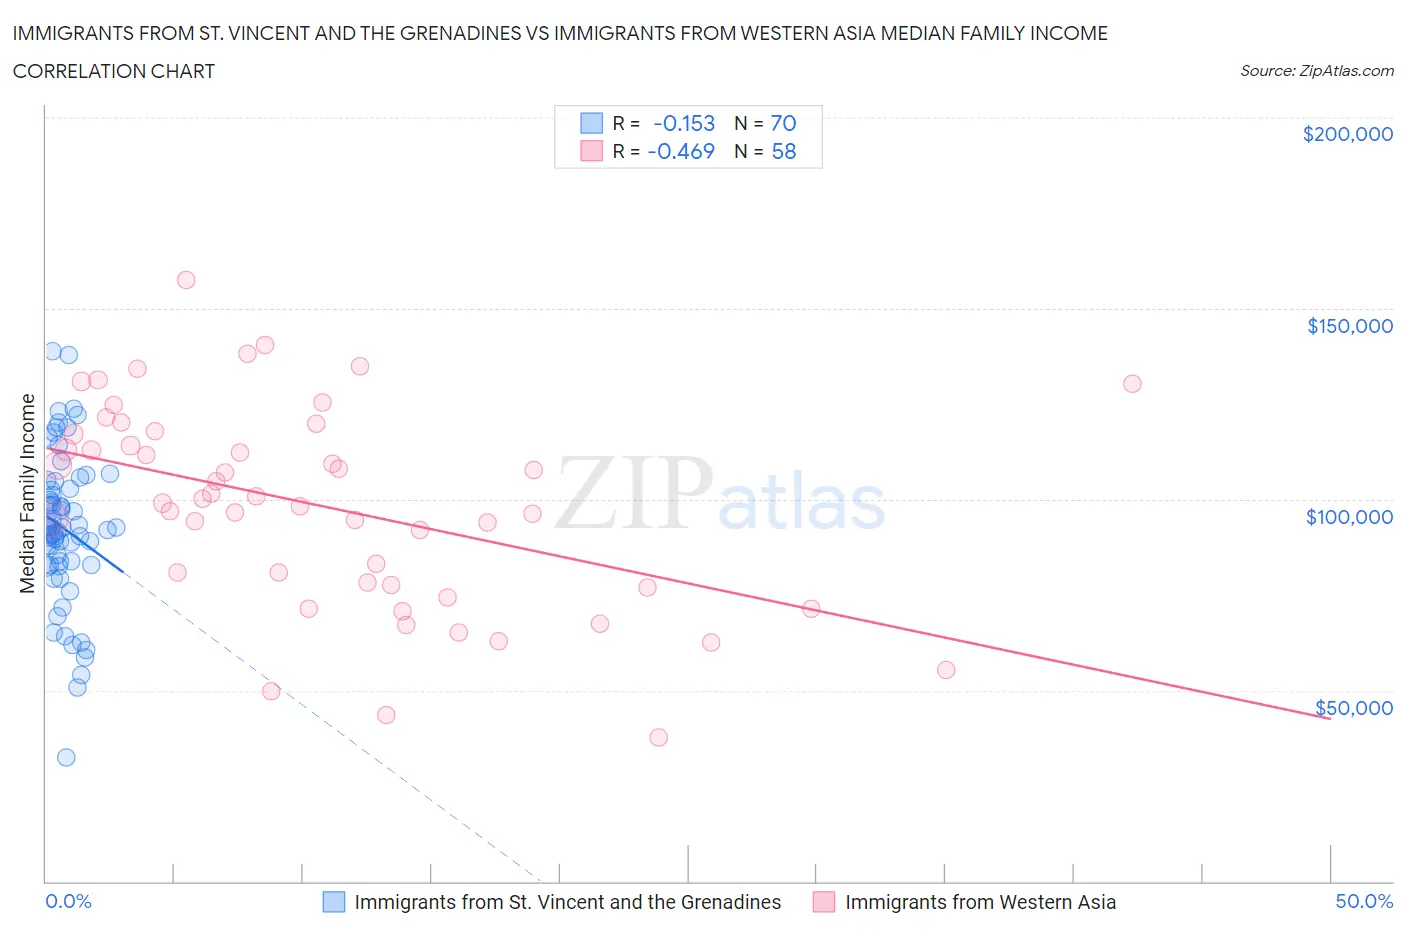
Immigrants from St. Vincent and the Grenadines vs Immigrants from Western Asia Median Family Income Correlation Chart
The statistical analysis conducted on geographies consisting of 56,186,074 people shows a poor negative correlation between the proportion of Immigrants from St. Vincent and the Grenadines and median family income in the United States with a correlation coefficient (R) of -0.153 and weighted average of $90,094. Similarly, the statistical analysis conducted on geographies consisting of 404,054,166 people shows a moderate negative correlation between the proportion of Immigrants from Western Asia and median family income in the United States with a correlation coefficient (R) of -0.469 and weighted average of $108,691, a difference of 20.6%.
Median Family Income Correlation Summary
| Measurement | Immigrants from St. Vincent and the Grenadines | Immigrants from Western Asia |
| Minimum | $32,289 | $37,540 |
| Maximum | $138,717 | $157,455 |
| Range | $106,428 | $119,915 |
| Mean | $92,358 | $98,085 |
| Median | $92,624 | $99,522 |
| Interquartile 25% (IQ1) | $82,866 | $77,576 |
| Interquartile 75% (IQ3) | $102,687 | $117,037 |
| Interquartile Range (IQR) | $19,821 | $39,461 |
| Standard Deviation (Sample) | $19,859 | $26,265 |
| Standard Deviation (Population) | $19,717 | $26,038 |
Similar Demographics by Median Family Income
Demographics Similar to Immigrants from St. Vincent and the Grenadines by Median Family Income
In terms of median family income, the demographic groups most similar to Immigrants from St. Vincent and the Grenadines are Spanish American ($90,322, a difference of 0.25%), Immigrants from Micronesia ($90,345, a difference of 0.28%), Immigrants from Liberia ($90,450, a difference of 0.40%), Iroquois ($90,543, a difference of 0.50%), and Jamaican ($90,581, a difference of 0.54%).
| Demographics | Rating | Rank | Median Family Income |
| Cree | 0.2 /100 | #268 | Tragic $90,882 |
| Belizeans | 0.2 /100 | #269 | Tragic $90,880 |
| Jamaicans | 0.2 /100 | #270 | Tragic $90,581 |
| Iroquois | 0.2 /100 | #271 | Tragic $90,543 |
| Immigrants | Liberia | 0.2 /100 | #272 | Tragic $90,450 |
| Immigrants | Micronesia | 0.2 /100 | #273 | Tragic $90,345 |
| Spanish Americans | 0.2 /100 | #274 | Tragic $90,322 |
| Immigrants | St. Vincent and the Grenadines | 0.2 /100 | #275 | Tragic $90,094 |
| Immigrants | Zaire | 0.1 /100 | #276 | Tragic $89,285 |
| Immigrants | Jamaica | 0.1 /100 | #277 | Tragic $89,268 |
| Immigrants | Grenada | 0.1 /100 | #278 | Tragic $89,249 |
| Immigrants | Belize | 0.1 /100 | #279 | Tragic $89,197 |
| British West Indians | 0.1 /100 | #280 | Tragic $88,987 |
| Blackfeet | 0.1 /100 | #281 | Tragic $88,717 |
| Comanche | 0.1 /100 | #282 | Tragic $88,556 |
Demographics Similar to Immigrants from Western Asia by Median Family Income
In terms of median family income, the demographic groups most similar to Immigrants from Western Asia are British ($108,705, a difference of 0.010%), Immigrants from Afghanistan ($108,709, a difference of 0.020%), Immigrants from Poland ($108,570, a difference of 0.11%), Immigrants from Zimbabwe ($108,830, a difference of 0.13%), and Immigrants from Saudi Arabia ($108,544, a difference of 0.14%).
| Demographics | Rating | Rank | Median Family Income |
| Palestinians | 96.9 /100 | #104 | Exceptional $109,413 |
| Syrians | 96.7 /100 | #105 | Exceptional $109,299 |
| Albanians | 96.4 /100 | #106 | Exceptional $109,136 |
| Immigrants | North Macedonia | 96.4 /100 | #107 | Exceptional $109,136 |
| Immigrants | Zimbabwe | 95.9 /100 | #108 | Exceptional $108,830 |
| Immigrants | Afghanistan | 95.6 /100 | #109 | Exceptional $108,709 |
| British | 95.6 /100 | #110 | Exceptional $108,705 |
| Immigrants | Western Asia | 95.6 /100 | #111 | Exceptional $108,691 |
| Immigrants | Poland | 95.3 /100 | #112 | Exceptional $108,570 |
| Immigrants | Saudi Arabia | 95.2 /100 | #113 | Exceptional $108,544 |
| Poles | 95.2 /100 | #114 | Exceptional $108,507 |
| Swedes | 95.1 /100 | #115 | Exceptional $108,499 |
| Chileans | 95.0 /100 | #116 | Exceptional $108,429 |
| Immigrants | Philippines | 94.6 /100 | #117 | Exceptional $108,288 |
| Ethiopians | 94.5 /100 | #118 | Exceptional $108,251 |