Immigrants from Sri Lanka vs Immigrants from Hungary Householder Income Ages 45 - 64 years
COMPARE
Immigrants from Sri Lanka
Immigrants from Hungary
Householder Income Ages 45 - 64 years
Householder Income Ages 45 - 64 years Comparison
Immigrants from Sri Lanka
Immigrants from Hungary
$119,094
HOUSEHOLDER INCOME AGES 45 - 64 YEARS
100.0/ 100
METRIC RATING
21st/ 347
METRIC RANK
$108,267
HOUSEHOLDER INCOME AGES 45 - 64 YEARS
98.2/ 100
METRIC RATING
95th/ 347
METRIC RANK
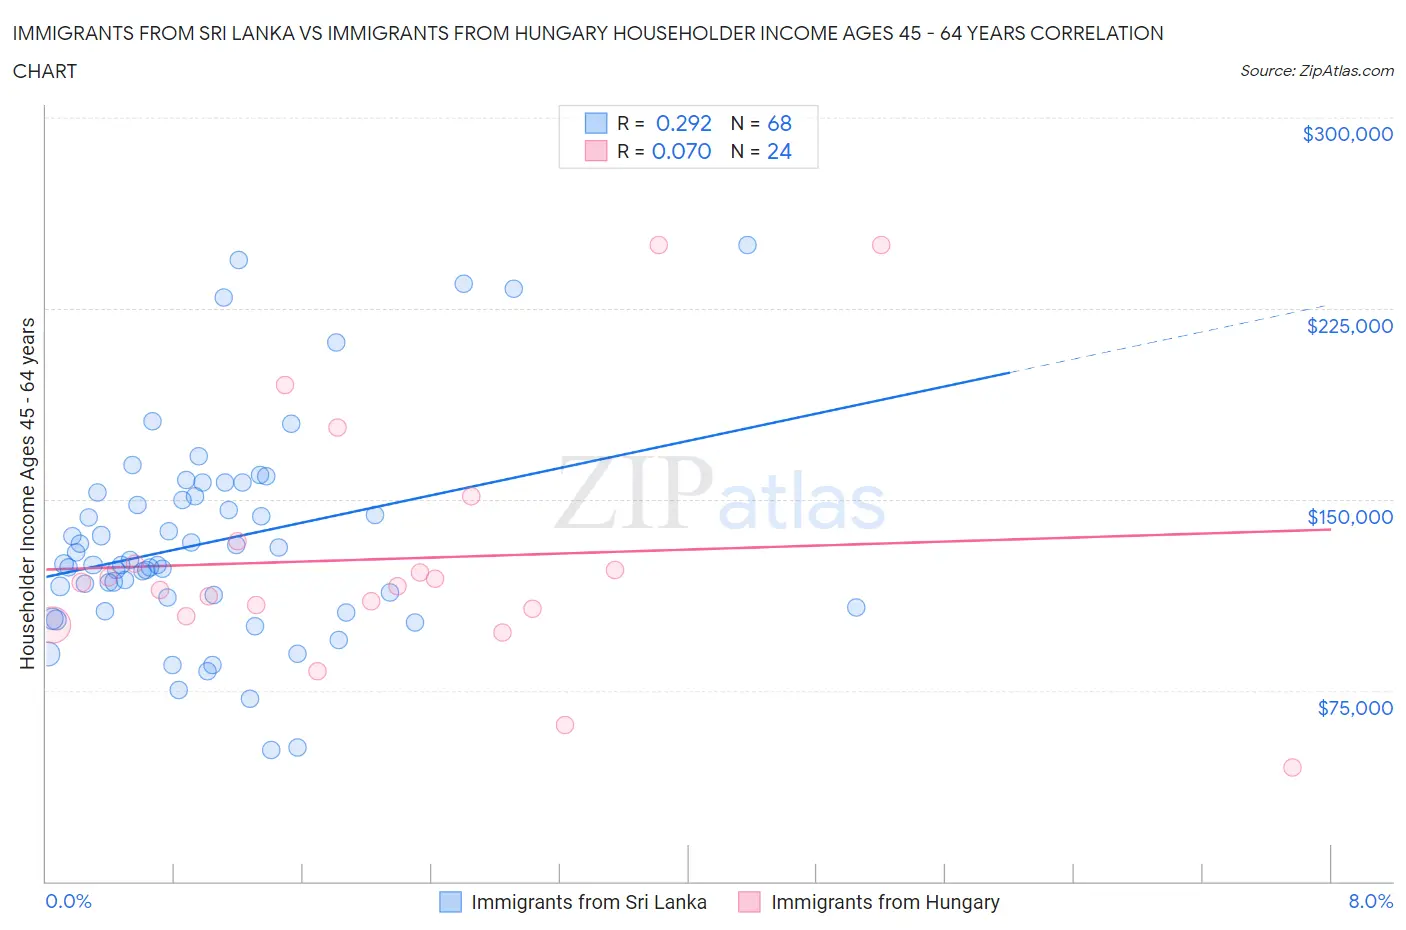
Immigrants from Sri Lanka vs Immigrants from Hungary Householder Income Ages 45 - 64 years Correlation Chart
The statistical analysis conducted on geographies consisting of 149,646,211 people shows a weak positive correlation between the proportion of Immigrants from Sri Lanka and household income with householder between the ages 45 and 64 in the United States with a correlation coefficient (R) of 0.292 and weighted average of $119,094. Similarly, the statistical analysis conducted on geographies consisting of 195,542,258 people shows a slight positive correlation between the proportion of Immigrants from Hungary and household income with householder between the ages 45 and 64 in the United States with a correlation coefficient (R) of 0.070 and weighted average of $108,267, a difference of 10.0%.
Householder Income Ages 45 - 64 years Correlation Summary
| Measurement | Immigrants from Sri Lanka | Immigrants from Hungary |
| Minimum | $51,635 | $44,685 |
| Maximum | $250,001 | $250,001 |
| Range | $198,366 | $205,316 |
| Mean | $133,379 | $126,709 |
| Median | $124,481 | $116,767 |
| Interquartile 25% (IQ1) | $109,443 | $105,544 |
| Interquartile 75% (IQ3) | $152,000 | $129,142 |
| Interquartile Range (IQR) | $42,557 | $23,598 |
| Standard Deviation (Sample) | $41,610 | $48,913 |
| Standard Deviation (Population) | $41,303 | $47,884 |
Similar Demographics by Householder Income Ages 45 - 64 years
Demographics Similar to Immigrants from Sri Lanka by Householder Income Ages 45 - 64 years
In terms of householder income ages 45 - 64 years, the demographic groups most similar to Immigrants from Sri Lanka are Immigrants from Belgium ($118,932, a difference of 0.14%), Immigrants from Australia ($119,308, a difference of 0.18%), Bolivian ($118,871, a difference of 0.19%), Immigrants from Japan ($118,498, a difference of 0.50%), and Asian ($118,426, a difference of 0.56%).
| Demographics | Rating | Rank | Householder Income Ages 45 - 64 years |
| Indians (Asian) | 100.0 /100 | #14 | Exceptional $122,343 |
| Immigrants | Eastern Asia | 100.0 /100 | #15 | Exceptional $122,222 |
| Immigrants | China | 100.0 /100 | #16 | Exceptional $122,178 |
| Burmese | 100.0 /100 | #17 | Exceptional $121,444 |
| Immigrants | Korea | 100.0 /100 | #18 | Exceptional $121,243 |
| Eastern Europeans | 100.0 /100 | #19 | Exceptional $120,684 |
| Immigrants | Australia | 100.0 /100 | #20 | Exceptional $119,308 |
| Immigrants | Sri Lanka | 100.0 /100 | #21 | Exceptional $119,094 |
| Immigrants | Belgium | 100.0 /100 | #22 | Exceptional $118,932 |
| Bolivians | 100.0 /100 | #23 | Exceptional $118,871 |
| Immigrants | Japan | 100.0 /100 | #24 | Exceptional $118,498 |
| Asians | 100.0 /100 | #25 | Exceptional $118,426 |
| Immigrants | Sweden | 100.0 /100 | #26 | Exceptional $118,318 |
| Immigrants | Northern Europe | 100.0 /100 | #27 | Exceptional $117,930 |
| Turks | 100.0 /100 | #28 | Exceptional $117,814 |
Demographics Similar to Immigrants from Hungary by Householder Income Ages 45 - 64 years
In terms of householder income ages 45 - 64 years, the demographic groups most similar to Immigrants from Hungary are Sri Lankan ($108,270, a difference of 0.0%), Immigrants from Argentina ($108,264, a difference of 0.0%), Immigrants from Croatia ($108,304, a difference of 0.030%), Croatian ($108,383, a difference of 0.11%), and Ukrainian ($108,475, a difference of 0.19%).
| Demographics | Rating | Rank | Householder Income Ages 45 - 64 years |
| Romanians | 98.5 /100 | #88 | Exceptional $108,609 |
| Ukrainians | 98.3 /100 | #89 | Exceptional $108,475 |
| Immigrants | Philippines | 98.3 /100 | #90 | Exceptional $108,471 |
| Immigrants | Lebanon | 98.3 /100 | #91 | Exceptional $108,471 |
| Croatians | 98.3 /100 | #92 | Exceptional $108,383 |
| Immigrants | Croatia | 98.2 /100 | #93 | Exceptional $108,304 |
| Sri Lankans | 98.2 /100 | #94 | Exceptional $108,270 |
| Immigrants | Hungary | 98.2 /100 | #95 | Exceptional $108,267 |
| Immigrants | Argentina | 98.2 /100 | #96 | Exceptional $108,264 |
| Northern Europeans | 97.8 /100 | #97 | Exceptional $107,870 |
| Immigrants | Southern Europe | 97.7 /100 | #98 | Exceptional $107,775 |
| Palestinians | 97.6 /100 | #99 | Exceptional $107,721 |
| Immigrants | Serbia | 97.4 /100 | #100 | Exceptional $107,569 |
| Immigrants | Kazakhstan | 97.2 /100 | #101 | Exceptional $107,378 |
| Immigrants | Moldova | 97.1 /100 | #102 | Exceptional $107,357 |