Immigrants from Sri Lanka vs Immigrants from Lithuania Householder Income Ages 45 - 64 years
COMPARE
Immigrants from Sri Lanka
Immigrants from Lithuania
Householder Income Ages 45 - 64 years
Householder Income Ages 45 - 64 years Comparison
Immigrants from Sri Lanka
Immigrants from Lithuania
$119,094
HOUSEHOLDER INCOME AGES 45 - 64 YEARS
100.0/ 100
METRIC RATING
21st/ 347
METRIC RANK
$114,336
HOUSEHOLDER INCOME AGES 45 - 64 YEARS
99.9/ 100
METRIC RATING
41st/ 347
METRIC RANK
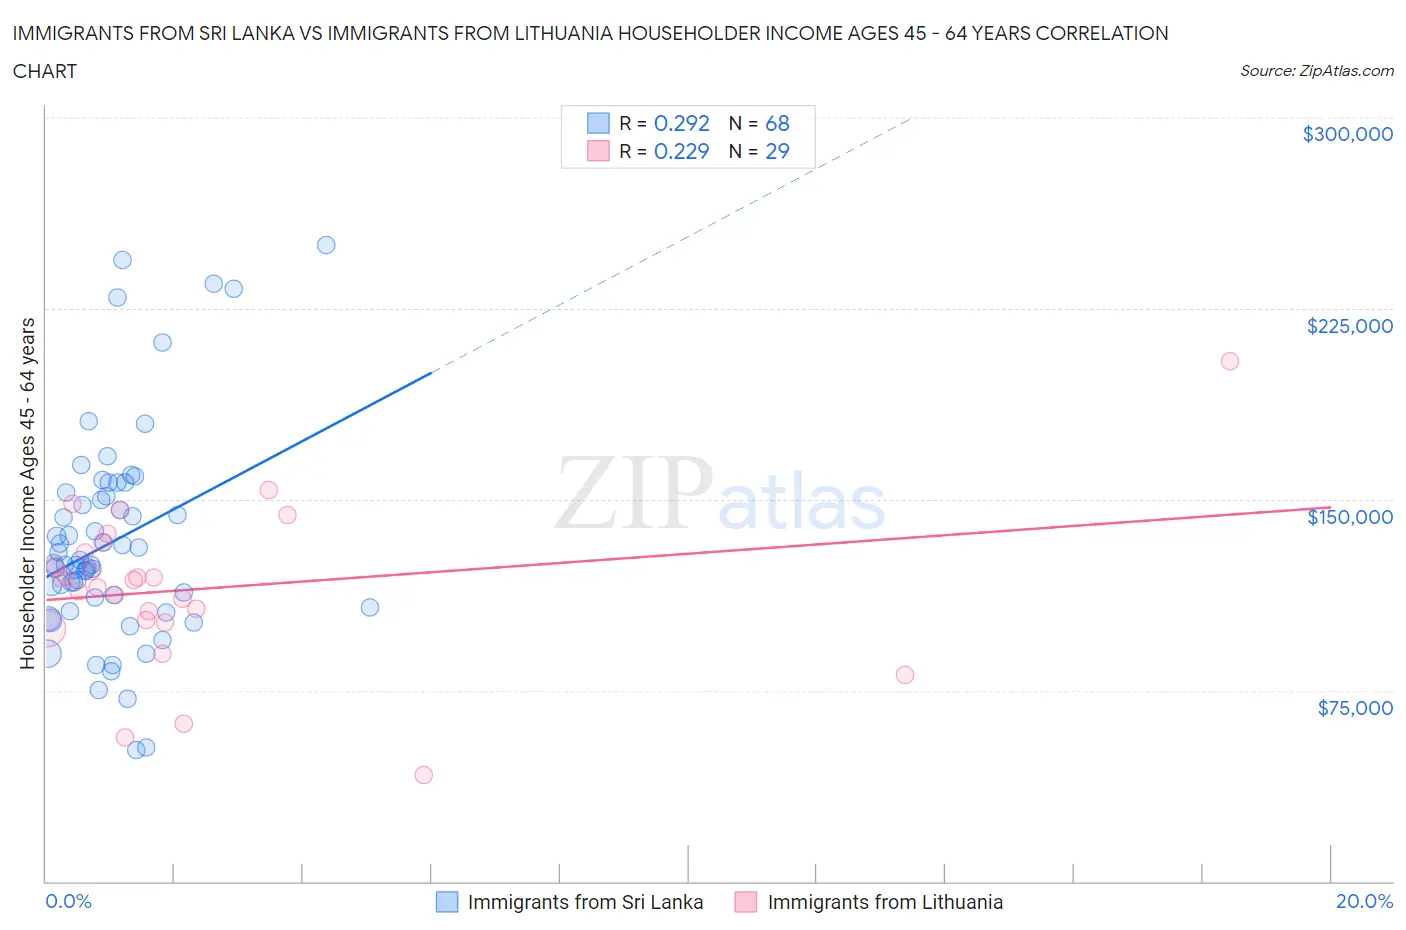
Immigrants from Sri Lanka vs Immigrants from Lithuania Householder Income Ages 45 - 64 years Correlation Chart
The statistical analysis conducted on geographies consisting of 149,646,211 people shows a weak positive correlation between the proportion of Immigrants from Sri Lanka and household income with householder between the ages 45 and 64 in the United States with a correlation coefficient (R) of 0.292 and weighted average of $119,094. Similarly, the statistical analysis conducted on geographies consisting of 117,696,258 people shows a weak positive correlation between the proportion of Immigrants from Lithuania and household income with householder between the ages 45 and 64 in the United States with a correlation coefficient (R) of 0.229 and weighted average of $114,336, a difference of 4.2%.
Householder Income Ages 45 - 64 years Correlation Summary
| Measurement | Immigrants from Sri Lanka | Immigrants from Lithuania |
| Minimum | $51,635 | $41,667 |
| Maximum | $250,001 | $204,500 |
| Range | $198,366 | $162,833 |
| Mean | $133,379 | $114,986 |
| Median | $124,481 | $118,271 |
| Interquartile 25% (IQ1) | $109,443 | $102,220 |
| Interquartile 75% (IQ3) | $152,000 | $131,130 |
| Interquartile Range (IQR) | $42,557 | $28,910 |
| Standard Deviation (Sample) | $41,610 | $31,501 |
| Standard Deviation (Population) | $41,303 | $30,953 |
Demographics Similar to Immigrants from Sri Lanka and Immigrants from Lithuania by Householder Income Ages 45 - 64 years
In terms of householder income ages 45 - 64 years, the demographic groups most similar to Immigrants from Sri Lanka are Immigrants from Belgium ($118,932, a difference of 0.14%), Bolivian ($118,871, a difference of 0.19%), Immigrants from Japan ($118,498, a difference of 0.50%), Asian ($118,426, a difference of 0.56%), and Immigrants from Sweden ($118,318, a difference of 0.66%). Similarly, the demographic groups most similar to Immigrants from Lithuania are Cambodian ($114,342, a difference of 0.010%), Immigrants from Turkey ($114,407, a difference of 0.060%), Immigrants from Pakistan ($114,434, a difference of 0.090%), Maltese ($114,754, a difference of 0.37%), and Immigrants from Switzerland ($115,934, a difference of 1.4%).
| Demographics | Rating | Rank | Householder Income Ages 45 - 64 years |
| Immigrants | Sri Lanka | 100.0 /100 | #21 | Exceptional $119,094 |
| Immigrants | Belgium | 100.0 /100 | #22 | Exceptional $118,932 |
| Bolivians | 100.0 /100 | #23 | Exceptional $118,871 |
| Immigrants | Japan | 100.0 /100 | #24 | Exceptional $118,498 |
| Asians | 100.0 /100 | #25 | Exceptional $118,426 |
| Immigrants | Sweden | 100.0 /100 | #26 | Exceptional $118,318 |
| Immigrants | Northern Europe | 100.0 /100 | #27 | Exceptional $117,930 |
| Turks | 100.0 /100 | #28 | Exceptional $117,814 |
| Bhutanese | 100.0 /100 | #29 | Exceptional $117,750 |
| Immigrants | Bolivia | 100.0 /100 | #30 | Exceptional $117,731 |
| Immigrants | Asia | 100.0 /100 | #31 | Exceptional $116,566 |
| Russians | 100.0 /100 | #32 | Exceptional $116,328 |
| Chinese | 100.0 /100 | #33 | Exceptional $116,156 |
| Immigrants | Denmark | 100.0 /100 | #34 | Exceptional $116,000 |
| Latvians | 100.0 /100 | #35 | Exceptional $115,957 |
| Immigrants | Switzerland | 100.0 /100 | #36 | Exceptional $115,934 |
| Maltese | 99.9 /100 | #37 | Exceptional $114,754 |
| Immigrants | Pakistan | 99.9 /100 | #38 | Exceptional $114,434 |
| Immigrants | Turkey | 99.9 /100 | #39 | Exceptional $114,407 |
| Cambodians | 99.9 /100 | #40 | Exceptional $114,342 |
| Immigrants | Lithuania | 99.9 /100 | #41 | Exceptional $114,336 |