Immigrants from Sri Lanka vs Immigrants from France Householder Income Ages 25 - 44 years
COMPARE
Immigrants from Sri Lanka
Immigrants from France
Householder Income Ages 25 - 44 years
Householder Income Ages 25 - 44 years Comparison
Immigrants from Sri Lanka
Immigrants from France
$109,741
HOUSEHOLDER INCOME AGES 25 - 44 YEARS
100.0/ 100
METRIC RATING
32nd/ 347
METRIC RANK
$108,257
HOUSEHOLDER INCOME AGES 25 - 44 YEARS
99.9/ 100
METRIC RATING
39th/ 347
METRIC RANK
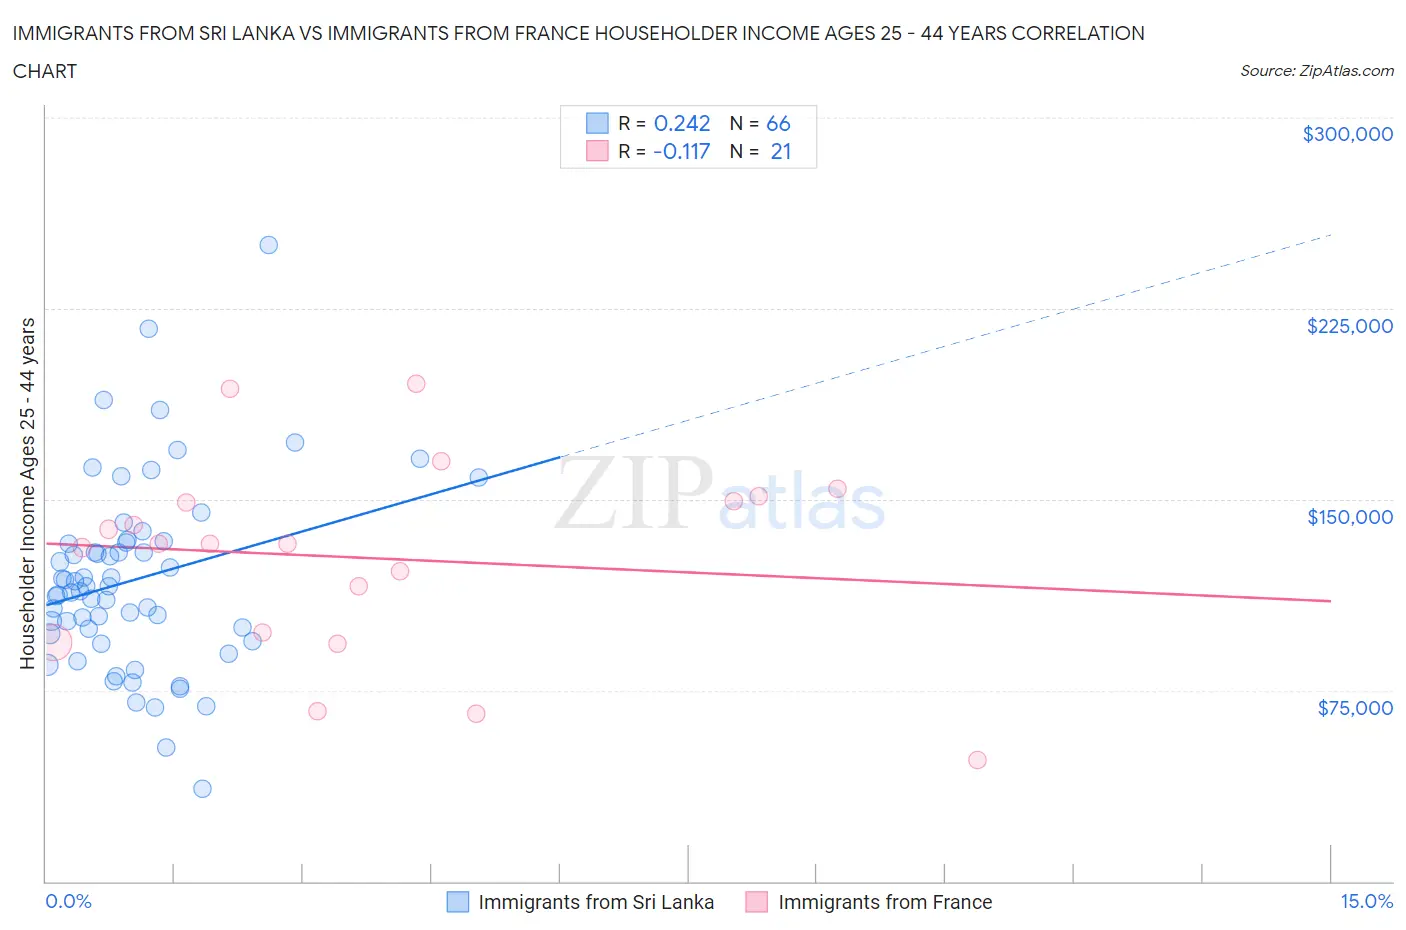
Immigrants from Sri Lanka vs Immigrants from France Householder Income Ages 25 - 44 years Correlation Chart
The statistical analysis conducted on geographies consisting of 149,615,906 people shows a weak positive correlation between the proportion of Immigrants from Sri Lanka and household income with householder between the ages 25 and 44 in the United States with a correlation coefficient (R) of 0.242 and weighted average of $109,741. Similarly, the statistical analysis conducted on geographies consisting of 287,397,429 people shows a poor negative correlation between the proportion of Immigrants from France and household income with householder between the ages 25 and 44 in the United States with a correlation coefficient (R) of -0.117 and weighted average of $108,257, a difference of 1.4%.
Householder Income Ages 25 - 44 years Correlation Summary
| Measurement | Immigrants from Sri Lanka | Immigrants from France |
| Minimum | $36,230 | $47,500 |
| Maximum | $250,001 | $195,321 |
| Range | $213,771 | $147,821 |
| Mean | $118,421 | $126,914 |
| Median | $114,758 | $132,431 |
| Interquartile 25% (IQ1) | $97,290 | $95,699 |
| Interquartile 75% (IQ3) | $133,038 | $150,220 |
| Interquartile Range (IQR) | $35,748 | $54,521 |
| Standard Deviation (Sample) | $37,121 | $38,836 |
| Standard Deviation (Population) | $36,839 | $37,900 |
Demographics Similar to Immigrants from Sri Lanka and Immigrants from France by Householder Income Ages 25 - 44 years
In terms of householder income ages 25 - 44 years, the demographic groups most similar to Immigrants from Sri Lanka are Bhutanese ($109,520, a difference of 0.20%), Maltese ($110,064, a difference of 0.29%), Immigrants from Greece ($110,103, a difference of 0.33%), Bolivian ($109,372, a difference of 0.34%), and Immigrants from Switzerland ($109,185, a difference of 0.51%). Similarly, the demographic groups most similar to Immigrants from France are Immigrants from Lithuania ($108,149, a difference of 0.10%), Immigrants from Bolivia ($108,128, a difference of 0.12%), Soviet Union ($108,457, a difference of 0.18%), Australian ($107,912, a difference of 0.32%), and Immigrants from Russia ($108,751, a difference of 0.46%).
| Demographics | Rating | Rank | Householder Income Ages 25 - 44 years |
| Immigrants | Northern Europe | 100.0 /100 | #25 | Exceptional $111,676 |
| Immigrants | Asia | 100.0 /100 | #26 | Exceptional $110,787 |
| Russians | 100.0 /100 | #27 | Exceptional $110,398 |
| Immigrants | Denmark | 100.0 /100 | #28 | Exceptional $110,363 |
| Turks | 100.0 /100 | #29 | Exceptional $110,318 |
| Immigrants | Greece | 100.0 /100 | #30 | Exceptional $110,103 |
| Maltese | 100.0 /100 | #31 | Exceptional $110,064 |
| Immigrants | Sri Lanka | 100.0 /100 | #32 | Exceptional $109,741 |
| Bhutanese | 100.0 /100 | #33 | Exceptional $109,520 |
| Bolivians | 100.0 /100 | #34 | Exceptional $109,372 |
| Immigrants | Switzerland | 100.0 /100 | #35 | Exceptional $109,185 |
| Latvians | 100.0 /100 | #36 | Exceptional $108,926 |
| Immigrants | Russia | 100.0 /100 | #37 | Exceptional $108,751 |
| Soviet Union | 100.0 /100 | #38 | Exceptional $108,457 |
| Immigrants | France | 99.9 /100 | #39 | Exceptional $108,257 |
| Immigrants | Lithuania | 99.9 /100 | #40 | Exceptional $108,149 |
| Immigrants | Bolivia | 99.9 /100 | #41 | Exceptional $108,128 |
| Australians | 99.9 /100 | #42 | Exceptional $107,912 |
| Immigrants | Malaysia | 99.9 /100 | #43 | Exceptional $107,650 |
| Immigrants | Indonesia | 99.9 /100 | #44 | Exceptional $107,627 |
| Israelis | 99.9 /100 | #45 | Exceptional $107,579 |