Immigrants from Uganda vs Immigrants from Yemen Householder Income Ages 25 - 44 years
COMPARE
Immigrants from Uganda
Immigrants from Yemen
Householder Income Ages 25 - 44 years
Householder Income Ages 25 - 44 years Comparison
Immigrants from Uganda
Immigrants from Yemen
$95,698
HOUSEHOLDER INCOME AGES 25 - 44 YEARS
65.2/ 100
METRIC RATING
157th/ 347
METRIC RANK
$73,043
HOUSEHOLDER INCOME AGES 25 - 44 YEARS
0.0/ 100
METRIC RATING
338th/ 347
METRIC RANK
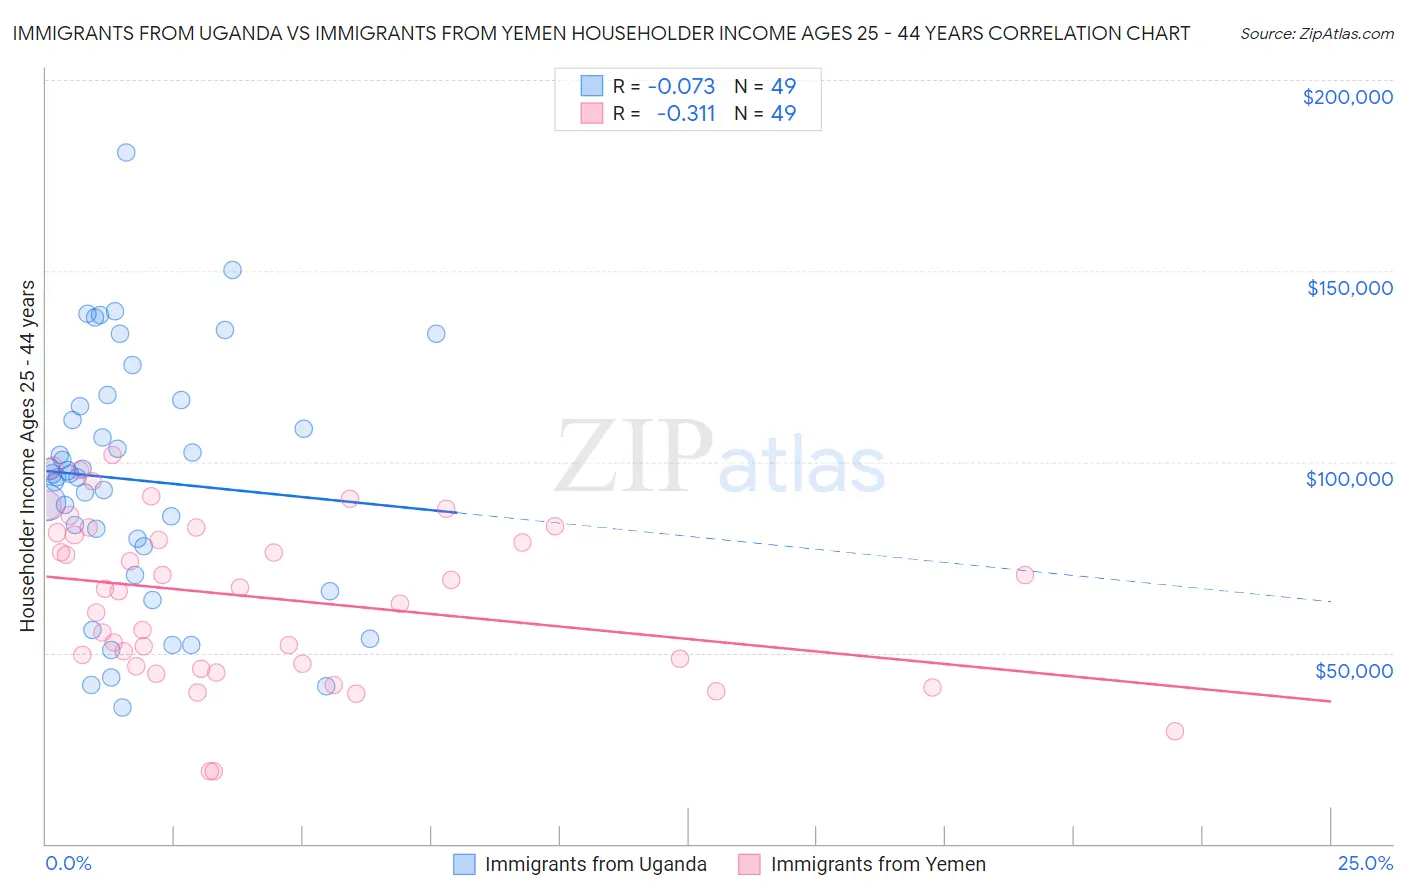
Immigrants from Uganda vs Immigrants from Yemen Householder Income Ages 25 - 44 years Correlation Chart
The statistical analysis conducted on geographies consisting of 125,922,646 people shows a slight negative correlation between the proportion of Immigrants from Uganda and household income with householder between the ages 25 and 44 in the United States with a correlation coefficient (R) of -0.073 and weighted average of $95,698. Similarly, the statistical analysis conducted on geographies consisting of 82,403,741 people shows a mild negative correlation between the proportion of Immigrants from Yemen and household income with householder between the ages 25 and 44 in the United States with a correlation coefficient (R) of -0.311 and weighted average of $73,043, a difference of 31.0%.
Householder Income Ages 25 - 44 years Correlation Summary
| Measurement | Immigrants from Uganda | Immigrants from Yemen |
| Minimum | $35,667 | $18,875 |
| Maximum | $180,909 | $101,667 |
| Range | $145,242 | $82,792 |
| Mean | $95,288 | $64,384 |
| Median | $96,887 | $66,841 |
| Interquartile 25% (IQ1) | $74,128 | $46,776 |
| Interquartile 75% (IQ3) | $115,286 | $82,060 |
| Interquartile Range (IQR) | $41,158 | $35,284 |
| Standard Deviation (Sample) | $32,223 | $21,181 |
| Standard Deviation (Population) | $31,892 | $20,964 |
Similar Demographics by Householder Income Ages 25 - 44 years
Demographics Similar to Immigrants from Uganda by Householder Income Ages 25 - 44 years
In terms of householder income ages 25 - 44 years, the demographic groups most similar to Immigrants from Uganda are Scandinavian ($95,596, a difference of 0.11%), Costa Rican ($95,565, a difference of 0.14%), Icelander ($95,560, a difference of 0.14%), Immigrants from Portugal ($95,512, a difference of 0.19%), and Swiss ($95,511, a difference of 0.20%).
| Demographics | Rating | Rank | Householder Income Ages 25 - 44 years |
| Ugandans | 76.2 /100 | #150 | Good $96,667 |
| Czechs | 74.8 /100 | #151 | Good $96,525 |
| South American Indians | 74.5 /100 | #152 | Good $96,497 |
| Slovenes | 73.9 /100 | #153 | Good $96,439 |
| Slavs | 73.2 /100 | #154 | Good $96,377 |
| Moroccans | 70.3 /100 | #155 | Good $96,117 |
| Immigrants | Germany | 67.9 /100 | #156 | Good $95,913 |
| Immigrants | Uganda | 65.2 /100 | #157 | Good $95,698 |
| Scandinavians | 63.9 /100 | #158 | Good $95,596 |
| Costa Ricans | 63.5 /100 | #159 | Good $95,565 |
| Icelanders | 63.4 /100 | #160 | Good $95,560 |
| Immigrants | Portugal | 62.8 /100 | #161 | Good $95,512 |
| Swiss | 62.8 /100 | #162 | Good $95,511 |
| Immigrants | Saudi Arabia | 62.0 /100 | #163 | Good $95,450 |
| South Americans | 60.9 /100 | #164 | Good $95,362 |
Demographics Similar to Immigrants from Yemen by Householder Income Ages 25 - 44 years
In terms of householder income ages 25 - 44 years, the demographic groups most similar to Immigrants from Yemen are Yuman ($72,956, a difference of 0.12%), Black/African American ($73,370, a difference of 0.45%), Yup'ik ($73,688, a difference of 0.88%), Immigrants from Congo ($72,178, a difference of 1.2%), and Arapaho ($71,697, a difference of 1.9%).
| Demographics | Rating | Rank | Householder Income Ages 25 - 44 years |
| Natives/Alaskans | 0.0 /100 | #331 | Tragic $75,647 |
| Bahamians | 0.0 /100 | #332 | Tragic $75,395 |
| Hopi | 0.0 /100 | #333 | Tragic $75,002 |
| Creek | 0.0 /100 | #334 | Tragic $74,847 |
| Kiowa | 0.0 /100 | #335 | Tragic $74,776 |
| Yup'ik | 0.0 /100 | #336 | Tragic $73,688 |
| Blacks/African Americans | 0.0 /100 | #337 | Tragic $73,370 |
| Immigrants | Yemen | 0.0 /100 | #338 | Tragic $73,043 |
| Yuman | 0.0 /100 | #339 | Tragic $72,956 |
| Immigrants | Congo | 0.0 /100 | #340 | Tragic $72,178 |
| Arapaho | 0.0 /100 | #341 | Tragic $71,697 |
| Crow | 0.0 /100 | #342 | Tragic $71,337 |
| Tohono O'odham | 0.0 /100 | #343 | Tragic $69,068 |
| Pueblo | 0.0 /100 | #344 | Tragic $68,910 |
| Navajo | 0.0 /100 | #345 | Tragic $66,529 |