Menominee vs Immigrants from Yemen Householder Income Ages 25 - 44 years
COMPARE
Menominee
Immigrants from Yemen
Householder Income Ages 25 - 44 years
Householder Income Ages 25 - 44 years Comparison
Menominee
Immigrants from Yemen
$79,358
HOUSEHOLDER INCOME AGES 25 - 44 YEARS
0.0/ 100
METRIC RATING
313th/ 347
METRIC RANK
$73,043
HOUSEHOLDER INCOME AGES 25 - 44 YEARS
0.0/ 100
METRIC RATING
338th/ 347
METRIC RANK
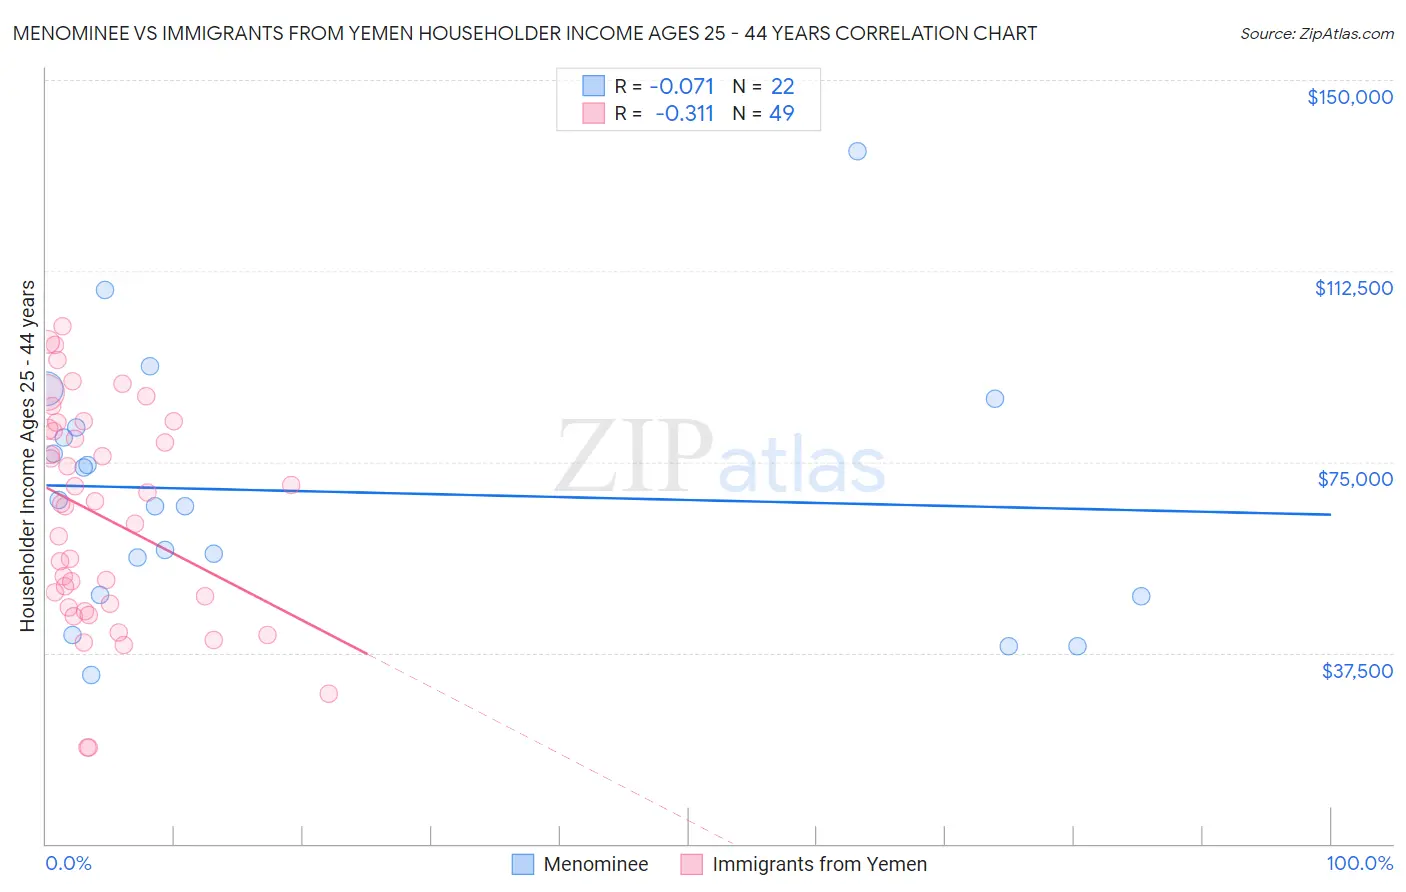
Menominee vs Immigrants from Yemen Householder Income Ages 25 - 44 years Correlation Chart
The statistical analysis conducted on geographies consisting of 45,763,833 people shows a slight negative correlation between the proportion of Menominee and household income with householder between the ages 25 and 44 in the United States with a correlation coefficient (R) of -0.071 and weighted average of $79,358. Similarly, the statistical analysis conducted on geographies consisting of 82,403,741 people shows a mild negative correlation between the proportion of Immigrants from Yemen and household income with householder between the ages 25 and 44 in the United States with a correlation coefficient (R) of -0.311 and weighted average of $73,043, a difference of 8.6%.
Householder Income Ages 25 - 44 years Correlation Summary
| Measurement | Menominee | Immigrants from Yemen |
| Minimum | $33,158 | $18,875 |
| Maximum | $135,924 | $101,667 |
| Range | $102,766 | $82,792 |
| Mean | $69,190 | $64,384 |
| Median | $66,974 | $66,841 |
| Interquartile 25% (IQ1) | $48,920 | $46,776 |
| Interquartile 75% (IQ3) | $81,800 | $82,060 |
| Interquartile Range (IQR) | $32,880 | $35,284 |
| Standard Deviation (Sample) | $24,876 | $21,181 |
| Standard Deviation (Population) | $24,304 | $20,964 |
Similar Demographics by Householder Income Ages 25 - 44 years
Demographics Similar to Menominee by Householder Income Ages 25 - 44 years
In terms of householder income ages 25 - 44 years, the demographic groups most similar to Menominee are Immigrants from Haiti ($79,391, a difference of 0.040%), Indonesian ($79,543, a difference of 0.23%), Cheyenne ($79,152, a difference of 0.26%), Ottawa ($79,012, a difference of 0.44%), and African ($78,986, a difference of 0.47%).
| Demographics | Rating | Rank | Householder Income Ages 25 - 44 years |
| Apache | 0.0 /100 | #306 | Tragic $80,260 |
| Haitians | 0.0 /100 | #307 | Tragic $80,055 |
| Immigrants | Central America | 0.0 /100 | #308 | Tragic $80,012 |
| Chippewa | 0.0 /100 | #309 | Tragic $80,005 |
| Fijians | 0.0 /100 | #310 | Tragic $79,956 |
| Indonesians | 0.0 /100 | #311 | Tragic $79,543 |
| Immigrants | Haiti | 0.0 /100 | #312 | Tragic $79,391 |
| Menominee | 0.0 /100 | #313 | Tragic $79,358 |
| Cheyenne | 0.0 /100 | #314 | Tragic $79,152 |
| Ottawa | 0.0 /100 | #315 | Tragic $79,012 |
| Africans | 0.0 /100 | #316 | Tragic $78,986 |
| U.S. Virgin Islanders | 0.0 /100 | #317 | Tragic $78,911 |
| Immigrants | Mexico | 0.0 /100 | #318 | Tragic $78,809 |
| Hondurans | 0.0 /100 | #319 | Tragic $78,540 |
| Choctaw | 0.0 /100 | #320 | Tragic $78,168 |
Demographics Similar to Immigrants from Yemen by Householder Income Ages 25 - 44 years
In terms of householder income ages 25 - 44 years, the demographic groups most similar to Immigrants from Yemen are Yuman ($72,956, a difference of 0.12%), Black/African American ($73,370, a difference of 0.45%), Yup'ik ($73,688, a difference of 0.88%), Immigrants from Congo ($72,178, a difference of 1.2%), and Arapaho ($71,697, a difference of 1.9%).
| Demographics | Rating | Rank | Householder Income Ages 25 - 44 years |
| Natives/Alaskans | 0.0 /100 | #331 | Tragic $75,647 |
| Bahamians | 0.0 /100 | #332 | Tragic $75,395 |
| Hopi | 0.0 /100 | #333 | Tragic $75,002 |
| Creek | 0.0 /100 | #334 | Tragic $74,847 |
| Kiowa | 0.0 /100 | #335 | Tragic $74,776 |
| Yup'ik | 0.0 /100 | #336 | Tragic $73,688 |
| Blacks/African Americans | 0.0 /100 | #337 | Tragic $73,370 |
| Immigrants | Yemen | 0.0 /100 | #338 | Tragic $73,043 |
| Yuman | 0.0 /100 | #339 | Tragic $72,956 |
| Immigrants | Congo | 0.0 /100 | #340 | Tragic $72,178 |
| Arapaho | 0.0 /100 | #341 | Tragic $71,697 |
| Crow | 0.0 /100 | #342 | Tragic $71,337 |
| Tohono O'odham | 0.0 /100 | #343 | Tragic $69,068 |
| Pueblo | 0.0 /100 | #344 | Tragic $68,910 |
| Navajo | 0.0 /100 | #345 | Tragic $66,529 |