Immigrants from South Eastern Asia vs Creek Nursery School
COMPARE
Immigrants from South Eastern Asia
Creek
Nursery School
Nursery School Comparison
Immigrants from South Eastern Asia
Creek
97.1%
NURSERY SCHOOL
0.0/ 100
METRIC RATING
301st/ 347
METRIC RANK
98.4%
NURSERY SCHOOL
99.7/ 100
METRIC RATING
62nd/ 347
METRIC RANK
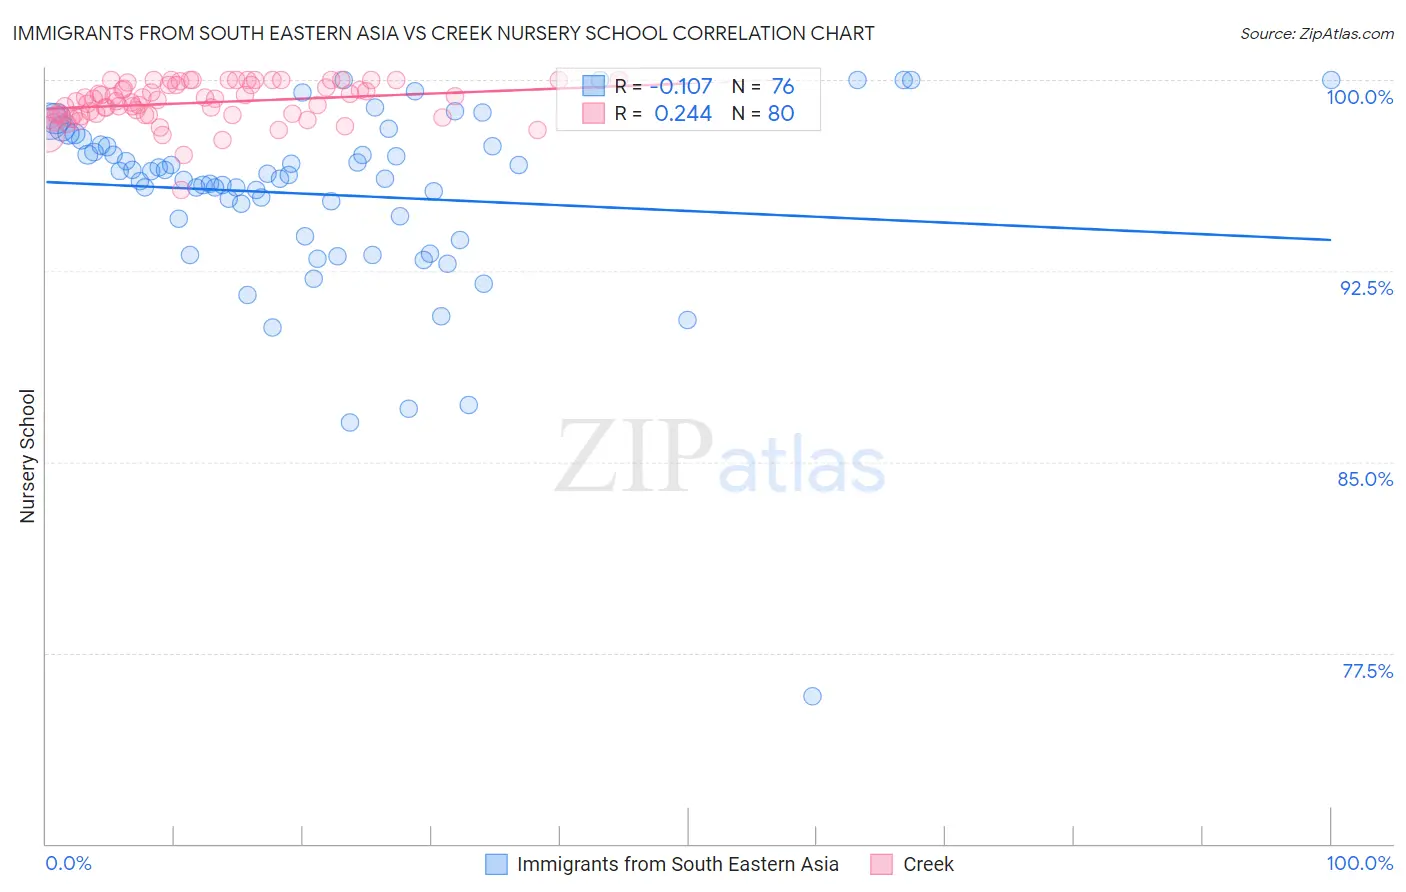
Immigrants from South Eastern Asia vs Creek Nursery School Correlation Chart
The statistical analysis conducted on geographies consisting of 512,710,277 people shows a poor negative correlation between the proportion of Immigrants from South Eastern Asia and percentage of population with at least nursery school education in the United States with a correlation coefficient (R) of -0.107 and weighted average of 97.1%. Similarly, the statistical analysis conducted on geographies consisting of 178,480,663 people shows a weak positive correlation between the proportion of Creek and percentage of population with at least nursery school education in the United States with a correlation coefficient (R) of 0.244 and weighted average of 98.4%, a difference of 1.3%.
Nursery School Correlation Summary
| Measurement | Immigrants from South Eastern Asia | Creek |
| Minimum | 75.8% | 95.7% |
| Maximum | 100.0% | 100.0% |
| Range | 24.2% | 4.3% |
| Mean | 95.5% | 99.1% |
| Median | 96.2% | 99.2% |
| Interquartile 25% (IQ1) | 94.2% | 98.6% |
| Interquartile 75% (IQ3) | 97.4% | 99.8% |
| Interquartile Range (IQR) | 3.2% | 1.2% |
| Standard Deviation (Sample) | 3.7% | 0.79% |
| Standard Deviation (Population) | 3.7% | 0.79% |
Similar Demographics by Nursery School
Demographics Similar to Immigrants from South Eastern Asia by Nursery School
In terms of nursery school, the demographic groups most similar to Immigrants from South Eastern Asia are Haitian (97.2%, a difference of 0.030%), Immigrants from Caribbean (97.1%, a difference of 0.030%), Central American Indian (97.2%, a difference of 0.050%), Immigrants from Dominica (97.2%, a difference of 0.050%), and Immigrants from Cuba (97.2%, a difference of 0.060%).
| Demographics | Rating | Rank | Nursery School |
| Immigrants | Grenada | 0.0 /100 | #294 | Tragic 97.3% |
| Immigrants | Immigrants | 0.0 /100 | #295 | Tragic 97.2% |
| Immigrants | Eritrea | 0.0 /100 | #296 | Tragic 97.2% |
| Immigrants | Cuba | 0.0 /100 | #297 | Tragic 97.2% |
| Central American Indians | 0.0 /100 | #298 | Tragic 97.2% |
| Immigrants | Dominica | 0.0 /100 | #299 | Tragic 97.2% |
| Haitians | 0.0 /100 | #300 | Tragic 97.2% |
| Immigrants | South Eastern Asia | 0.0 /100 | #301 | Tragic 97.1% |
| Immigrants | Caribbean | 0.0 /100 | #302 | Tragic 97.1% |
| Nicaraguans | 0.0 /100 | #303 | Tragic 97.1% |
| Ecuadorians | 0.0 /100 | #304 | Tragic 97.1% |
| Somalis | 0.0 /100 | #305 | Tragic 97.1% |
| Belizeans | 0.0 /100 | #306 | Tragic 97.0% |
| Hispanics or Latinos | 0.0 /100 | #307 | Tragic 97.0% |
| Immigrants | Haiti | 0.0 /100 | #308 | Tragic 97.0% |
Demographics Similar to Creek by Nursery School
In terms of nursery school, the demographic groups most similar to Creek are Immigrants from Canada (98.4%, a difference of 0.0%), Slavic (98.4%, a difference of 0.0%), New Zealander (98.4%, a difference of 0.0%), Immigrants from North America (98.4%, a difference of 0.0%), and Greek (98.4%, a difference of 0.0%).
| Demographics | Rating | Rank | Nursery School |
| Immigrants | Scotland | 99.8 /100 | #55 | Exceptional 98.4% |
| Americans | 99.8 /100 | #56 | Exceptional 98.4% |
| Austrians | 99.8 /100 | #57 | Exceptional 98.4% |
| Bulgarians | 99.8 /100 | #58 | Exceptional 98.4% |
| Immigrants | Canada | 99.8 /100 | #59 | Exceptional 98.4% |
| Slavs | 99.8 /100 | #60 | Exceptional 98.4% |
| New Zealanders | 99.7 /100 | #61 | Exceptional 98.4% |
| Creek | 99.7 /100 | #62 | Exceptional 98.4% |
| Immigrants | North America | 99.7 /100 | #63 | Exceptional 98.4% |
| Greeks | 99.7 /100 | #64 | Exceptional 98.4% |
| Maltese | 99.7 /100 | #65 | Exceptional 98.4% |
| Canadians | 99.7 /100 | #66 | Exceptional 98.4% |
| Immigrants | Northern Europe | 99.6 /100 | #67 | Exceptional 98.4% |
| Russians | 99.6 /100 | #68 | Exceptional 98.4% |
| Immigrants | Austria | 99.6 /100 | #69 | Exceptional 98.4% |