Immigrants from South Central Asia vs Dutch Child Poverty Among Girls Under 16
COMPARE
Immigrants from South Central Asia
Dutch
Child Poverty Among Girls Under 16
Child Poverty Among Girls Under 16 Comparison
Immigrants from South Central Asia
Dutch
12.7%
CHILD POVERTY AMONG GIRLS UNDER 16
100.0/ 100
METRIC RATING
11th/ 347
METRIC RANK
15.1%
CHILD POVERTY AMONG GIRLS UNDER 16
94.3/ 100
METRIC RATING
113th/ 347
METRIC RANK
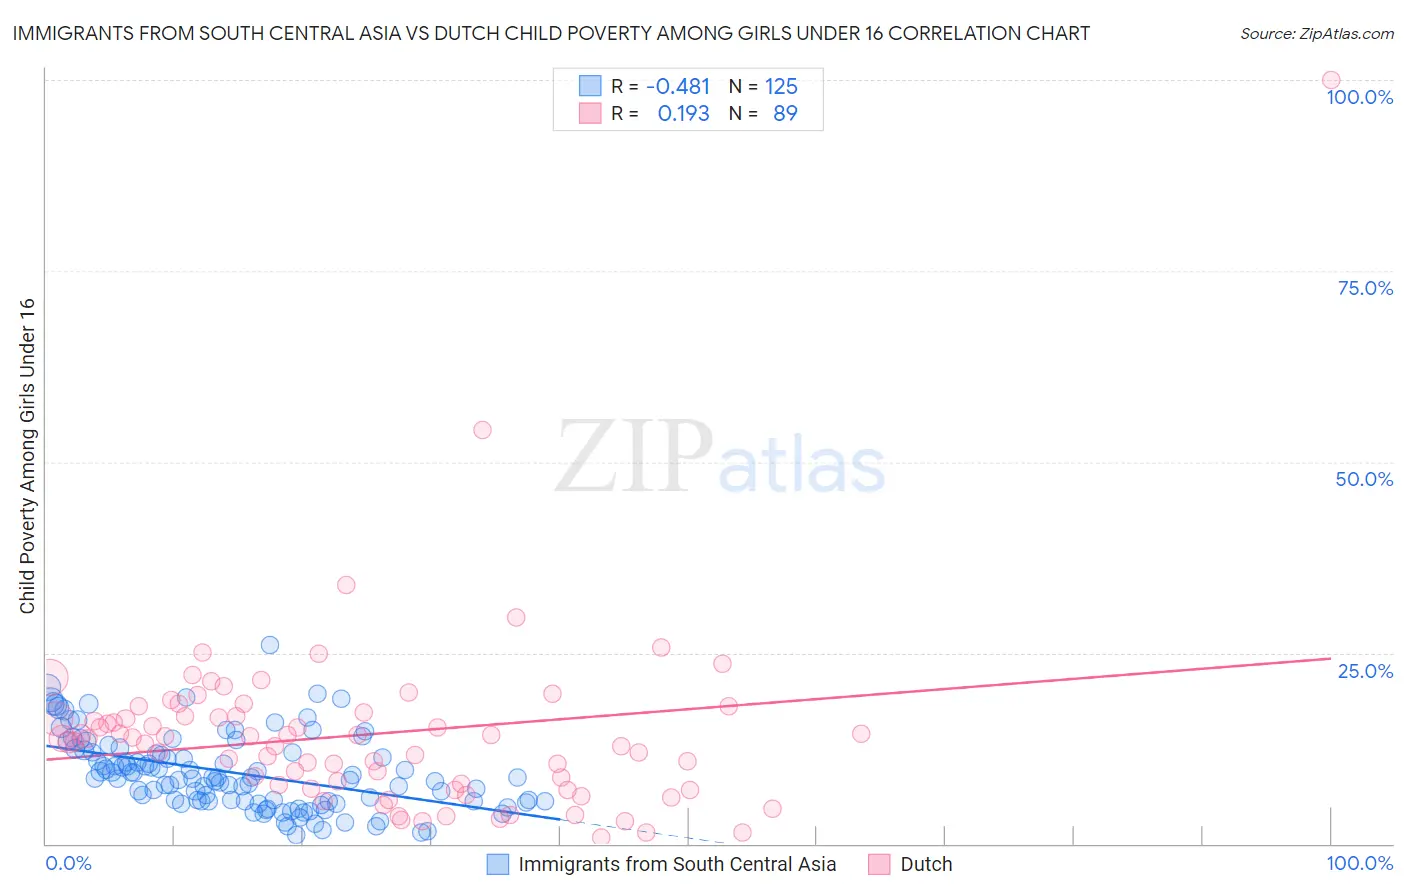
Immigrants from South Central Asia vs Dutch Child Poverty Among Girls Under 16 Correlation Chart
The statistical analysis conducted on geographies consisting of 461,235,402 people shows a moderate negative correlation between the proportion of Immigrants from South Central Asia and poverty level among girls under the age of 16 in the United States with a correlation coefficient (R) of -0.481 and weighted average of 12.7%. Similarly, the statistical analysis conducted on geographies consisting of 533,855,440 people shows a poor positive correlation between the proportion of Dutch and poverty level among girls under the age of 16 in the United States with a correlation coefficient (R) of 0.193 and weighted average of 15.1%, a difference of 18.9%.
Child Poverty Among Girls Under 16 Correlation Summary
| Measurement | Immigrants from South Central Asia | Dutch |
| Minimum | 1.2% | 0.74% |
| Maximum | 26.1% | 100.0% |
| Range | 24.8% | 99.3% |
| Mean | 9.3% | 14.3% |
| Median | 8.6% | 13.8% |
| Interquartile 25% (IQ1) | 5.6% | 7.4% |
| Interquartile 75% (IQ3) | 12.1% | 17.0% |
| Interquartile Range (IQR) | 6.5% | 9.5% |
| Standard Deviation (Sample) | 4.8% | 12.2% |
| Standard Deviation (Population) | 4.8% | 12.1% |
Similar Demographics by Child Poverty Among Girls Under 16
Demographics Similar to Immigrants from South Central Asia by Child Poverty Among Girls Under 16
In terms of child poverty among girls under 16, the demographic groups most similar to Immigrants from South Central Asia are Bhutanese (12.7%, a difference of 0.040%), Immigrants from Ireland (12.9%, a difference of 1.1%), Immigrants from Iran (12.6%, a difference of 1.3%), Burmese (13.0%, a difference of 2.2%), and Okinawan (13.0%, a difference of 2.2%).
| Demographics | Rating | Rank | Child Poverty Among Girls Under 16 |
| Tsimshian | 100.0 /100 | #4 | Exceptional 11.5% |
| Thais | 100.0 /100 | #5 | Exceptional 11.8% |
| Immigrants | Hong Kong | 100.0 /100 | #6 | Exceptional 12.3% |
| Chinese | 100.0 /100 | #7 | Exceptional 12.3% |
| Iranians | 100.0 /100 | #8 | Exceptional 12.4% |
| Immigrants | Singapore | 100.0 /100 | #9 | Exceptional 12.5% |
| Immigrants | Iran | 100.0 /100 | #10 | Exceptional 12.6% |
| Immigrants | South Central Asia | 100.0 /100 | #11 | Exceptional 12.7% |
| Bhutanese | 100.0 /100 | #12 | Exceptional 12.7% |
| Immigrants | Ireland | 99.9 /100 | #13 | Exceptional 12.9% |
| Burmese | 99.9 /100 | #14 | Exceptional 13.0% |
| Okinawans | 99.9 /100 | #15 | Exceptional 13.0% |
| Immigrants | Lithuania | 99.9 /100 | #16 | Exceptional 13.1% |
| Bulgarians | 99.9 /100 | #17 | Exceptional 13.1% |
| Immigrants | Korea | 99.9 /100 | #18 | Exceptional 13.1% |
Demographics Similar to Dutch by Child Poverty Among Girls Under 16
In terms of child poverty among girls under 16, the demographic groups most similar to Dutch are Immigrants from Kazakhstan (15.1%, a difference of 0.020%), Sri Lankan (15.2%, a difference of 0.13%), Palestinian (15.1%, a difference of 0.16%), Belgian (15.2%, a difference of 0.19%), and Immigrants from Croatia (15.1%, a difference of 0.20%).
| Demographics | Rating | Rank | Child Poverty Among Girls Under 16 |
| Chileans | 95.1 /100 | #106 | Exceptional 15.1% |
| Immigrants | Ukraine | 95.0 /100 | #107 | Exceptional 15.1% |
| Immigrants | Brazil | 94.9 /100 | #108 | Exceptional 15.1% |
| Serbians | 94.8 /100 | #109 | Exceptional 15.1% |
| Immigrants | Croatia | 94.6 /100 | #110 | Exceptional 15.1% |
| Palestinians | 94.5 /100 | #111 | Exceptional 15.1% |
| Immigrants | Kazakhstan | 94.3 /100 | #112 | Exceptional 15.1% |
| Dutch | 94.3 /100 | #113 | Exceptional 15.1% |
| Sri Lankans | 94.0 /100 | #114 | Exceptional 15.2% |
| Belgians | 93.9 /100 | #115 | Exceptional 15.2% |
| Immigrants | Denmark | 93.3 /100 | #116 | Exceptional 15.2% |
| Immigrants | North Macedonia | 93.1 /100 | #117 | Exceptional 15.2% |
| Immigrants | Southern Europe | 92.7 /100 | #118 | Exceptional 15.3% |
| Immigrants | Zimbabwe | 92.5 /100 | #119 | Exceptional 15.3% |
| Pakistanis | 92.3 /100 | #120 | Exceptional 15.3% |