Immigrants from South Africa vs Belgian Householder Income Ages 45 - 64 years
COMPARE
Immigrants from South Africa
Belgian
Householder Income Ages 45 - 64 years
Householder Income Ages 45 - 64 years Comparison
Immigrants from South Africa
Belgians
$112,886
HOUSEHOLDER INCOME AGES 45 - 64 YEARS
99.8/ 100
METRIC RATING
51st/ 347
METRIC RANK
$100,060
HOUSEHOLDER INCOME AGES 45 - 64 YEARS
46.7/ 100
METRIC RATING
179th/ 347
METRIC RANK
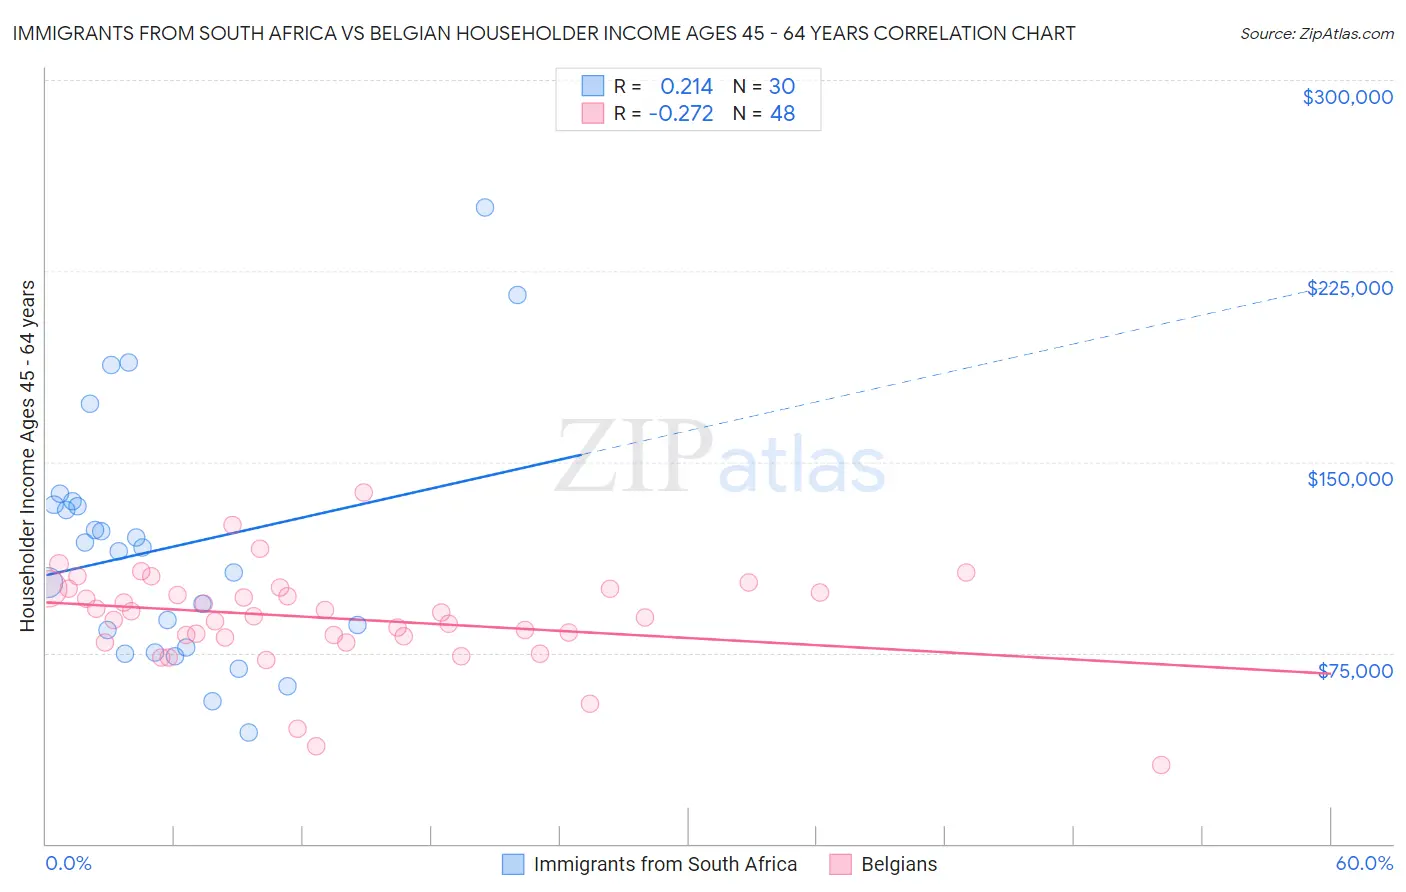
Immigrants from South Africa vs Belgian Householder Income Ages 45 - 64 years Correlation Chart
The statistical analysis conducted on geographies consisting of 233,154,360 people shows a weak positive correlation between the proportion of Immigrants from South Africa and household income with householder between the ages 45 and 64 in the United States with a correlation coefficient (R) of 0.214 and weighted average of $112,886. Similarly, the statistical analysis conducted on geographies consisting of 355,498,579 people shows a weak negative correlation between the proportion of Belgians and household income with householder between the ages 45 and 64 in the United States with a correlation coefficient (R) of -0.272 and weighted average of $100,060, a difference of 12.8%.
Householder Income Ages 45 - 64 years Correlation Summary
| Measurement | Immigrants from South Africa | Belgian |
| Minimum | $43,750 | $30,833 |
| Maximum | $250,001 | $138,162 |
| Range | $206,251 | $107,329 |
| Mean | $116,416 | $88,608 |
| Median | $115,780 | $89,979 |
| Interquartile 25% (IQ1) | $77,125 | $81,216 |
| Interquartile 75% (IQ3) | $133,043 | $100,318 |
| Interquartile Range (IQR) | $55,918 | $19,101 |
| Standard Deviation (Sample) | $48,210 | $19,546 |
| Standard Deviation (Population) | $47,400 | $19,341 |
Similar Demographics by Householder Income Ages 45 - 64 years
Demographics Similar to Immigrants from South Africa by Householder Income Ages 45 - 64 years
In terms of householder income ages 45 - 64 years, the demographic groups most similar to Immigrants from South Africa are Immigrants from Malaysia ($112,796, a difference of 0.080%), Afghan ($112,676, a difference of 0.19%), Immigrants from Austria ($113,140, a difference of 0.22%), Greek ($112,630, a difference of 0.23%), and Immigrants from Russia ($113,215, a difference of 0.29%).
| Demographics | Rating | Rank | Householder Income Ages 45 - 64 years |
| Bulgarians | 99.9 /100 | #44 | Exceptional $113,883 |
| Immigrants | France | 99.9 /100 | #45 | Exceptional $113,680 |
| Immigrants | Greece | 99.9 /100 | #46 | Exceptional $113,548 |
| Australians | 99.9 /100 | #47 | Exceptional $113,533 |
| Immigrants | Indonesia | 99.9 /100 | #48 | Exceptional $113,519 |
| Immigrants | Russia | 99.8 /100 | #49 | Exceptional $113,215 |
| Immigrants | Austria | 99.8 /100 | #50 | Exceptional $113,140 |
| Immigrants | South Africa | 99.8 /100 | #51 | Exceptional $112,886 |
| Immigrants | Malaysia | 99.8 /100 | #52 | Exceptional $112,796 |
| Afghans | 99.8 /100 | #53 | Exceptional $112,676 |
| Greeks | 99.8 /100 | #54 | Exceptional $112,630 |
| Lithuanians | 99.8 /100 | #55 | Exceptional $112,484 |
| Egyptians | 99.7 /100 | #56 | Exceptional $112,256 |
| Immigrants | Scotland | 99.7 /100 | #57 | Exceptional $112,175 |
| Soviet Union | 99.7 /100 | #58 | Exceptional $112,008 |
Demographics Similar to Belgians by Householder Income Ages 45 - 64 years
In terms of householder income ages 45 - 64 years, the demographic groups most similar to Belgians are Aleut ($100,052, a difference of 0.010%), Immigrants from Cameroon ($100,084, a difference of 0.020%), Immigrants from Costa Rica ($100,141, a difference of 0.080%), Moroccan ($100,138, a difference of 0.080%), and Immigrants ($99,943, a difference of 0.12%).
| Demographics | Rating | Rank | Householder Income Ages 45 - 64 years |
| Immigrants | Uzbekistan | 52.5 /100 | #172 | Average $100,523 |
| Alsatians | 51.4 /100 | #173 | Average $100,435 |
| Welsh | 50.0 /100 | #174 | Average $100,322 |
| Germans | 48.8 /100 | #175 | Average $100,224 |
| Immigrants | Costa Rica | 47.7 /100 | #176 | Average $100,141 |
| Moroccans | 47.7 /100 | #177 | Average $100,138 |
| Immigrants | Cameroon | 47.0 /100 | #178 | Average $100,084 |
| Belgians | 46.7 /100 | #179 | Average $100,060 |
| Aleuts | 46.6 /100 | #180 | Average $100,052 |
| Immigrants | Immigrants | 45.3 /100 | #181 | Average $99,943 |
| Finns | 44.8 /100 | #182 | Average $99,904 |
| Spaniards | 44.6 /100 | #183 | Average $99,889 |
| French | 43.8 /100 | #184 | Average $99,824 |
| Colombians | 43.2 /100 | #185 | Average $99,772 |
| Dutch | 41.7 /100 | #186 | Average $99,650 |