Immigrants from South Africa vs Immigrants from Haiti Householder Income Ages 45 - 64 years
COMPARE
Immigrants from South Africa
Immigrants from Haiti
Householder Income Ages 45 - 64 years
Householder Income Ages 45 - 64 years Comparison
Immigrants from South Africa
Immigrants from Haiti
$112,886
HOUSEHOLDER INCOME AGES 45 - 64 YEARS
99.8/ 100
METRIC RATING
51st/ 347
METRIC RANK
$83,257
HOUSEHOLDER INCOME AGES 45 - 64 YEARS
0.0/ 100
METRIC RATING
310th/ 347
METRIC RANK
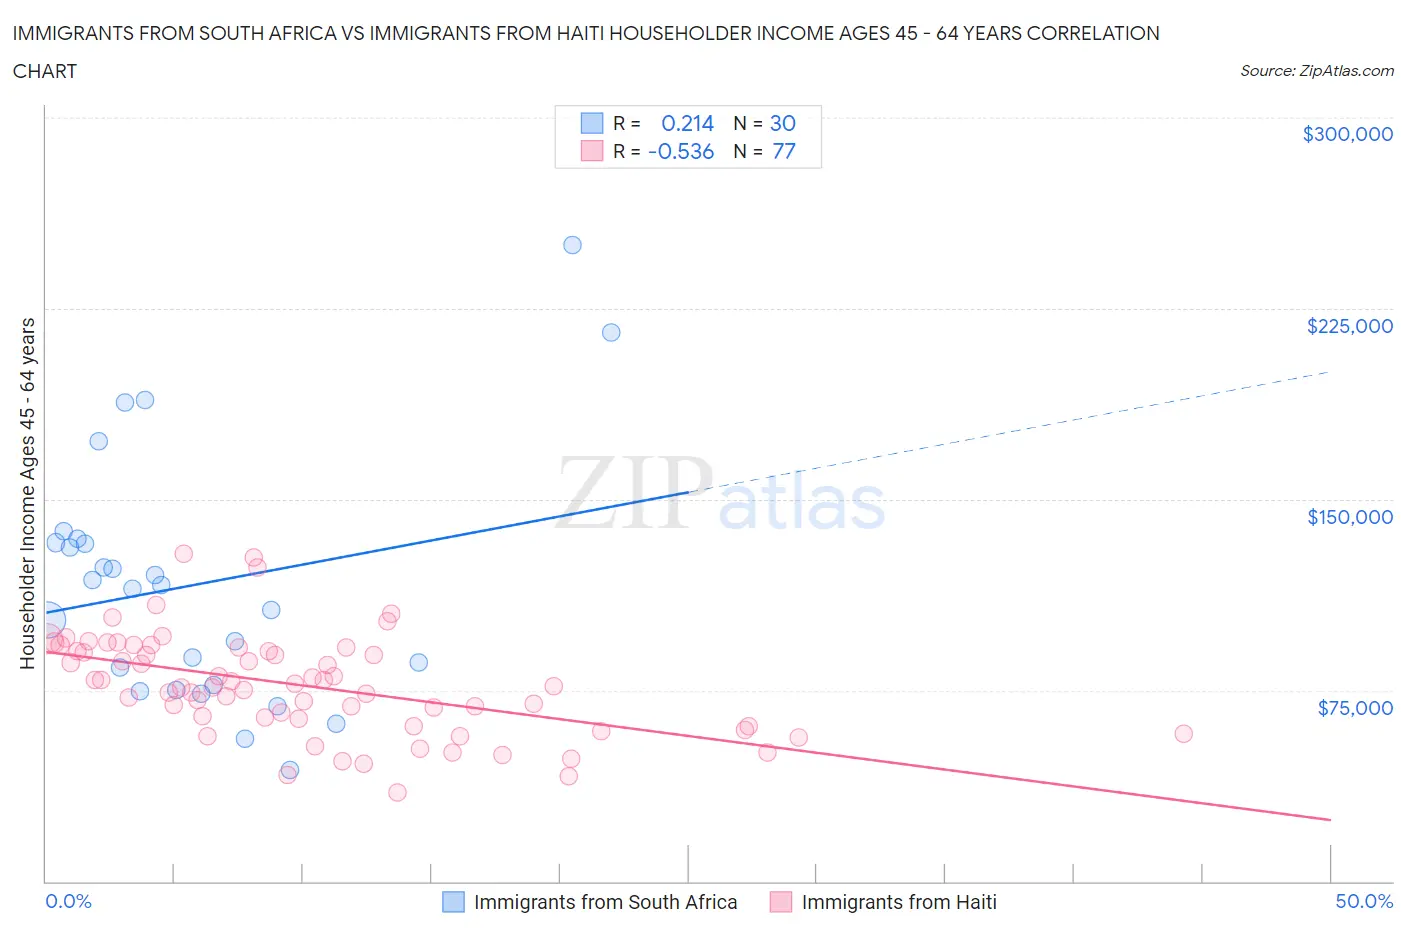
Immigrants from South Africa vs Immigrants from Haiti Householder Income Ages 45 - 64 years Correlation Chart
The statistical analysis conducted on geographies consisting of 233,154,360 people shows a weak positive correlation between the proportion of Immigrants from South Africa and household income with householder between the ages 45 and 64 in the United States with a correlation coefficient (R) of 0.214 and weighted average of $112,886. Similarly, the statistical analysis conducted on geographies consisting of 225,001,886 people shows a substantial negative correlation between the proportion of Immigrants from Haiti and household income with householder between the ages 45 and 64 in the United States with a correlation coefficient (R) of -0.536 and weighted average of $83,257, a difference of 35.6%.
Householder Income Ages 45 - 64 years Correlation Summary
| Measurement | Immigrants from South Africa | Immigrants from Haiti |
| Minimum | $43,750 | $34,634 |
| Maximum | $250,001 | $128,551 |
| Range | $206,251 | $93,917 |
| Mean | $116,416 | $76,930 |
| Median | $115,780 | $76,731 |
| Interquartile 25% (IQ1) | $77,125 | $62,422 |
| Interquartile 75% (IQ3) | $133,043 | $91,231 |
| Interquartile Range (IQR) | $55,918 | $28,809 |
| Standard Deviation (Sample) | $48,210 | $19,640 |
| Standard Deviation (Population) | $47,400 | $19,512 |
Similar Demographics by Householder Income Ages 45 - 64 years
Demographics Similar to Immigrants from South Africa by Householder Income Ages 45 - 64 years
In terms of householder income ages 45 - 64 years, the demographic groups most similar to Immigrants from South Africa are Immigrants from Malaysia ($112,796, a difference of 0.080%), Afghan ($112,676, a difference of 0.19%), Immigrants from Austria ($113,140, a difference of 0.22%), Greek ($112,630, a difference of 0.23%), and Immigrants from Russia ($113,215, a difference of 0.29%).
| Demographics | Rating | Rank | Householder Income Ages 45 - 64 years |
| Bulgarians | 99.9 /100 | #44 | Exceptional $113,883 |
| Immigrants | France | 99.9 /100 | #45 | Exceptional $113,680 |
| Immigrants | Greece | 99.9 /100 | #46 | Exceptional $113,548 |
| Australians | 99.9 /100 | #47 | Exceptional $113,533 |
| Immigrants | Indonesia | 99.9 /100 | #48 | Exceptional $113,519 |
| Immigrants | Russia | 99.8 /100 | #49 | Exceptional $113,215 |
| Immigrants | Austria | 99.8 /100 | #50 | Exceptional $113,140 |
| Immigrants | South Africa | 99.8 /100 | #51 | Exceptional $112,886 |
| Immigrants | Malaysia | 99.8 /100 | #52 | Exceptional $112,796 |
| Afghans | 99.8 /100 | #53 | Exceptional $112,676 |
| Greeks | 99.8 /100 | #54 | Exceptional $112,630 |
| Lithuanians | 99.8 /100 | #55 | Exceptional $112,484 |
| Egyptians | 99.7 /100 | #56 | Exceptional $112,256 |
| Immigrants | Scotland | 99.7 /100 | #57 | Exceptional $112,175 |
| Soviet Union | 99.7 /100 | #58 | Exceptional $112,008 |
Demographics Similar to Immigrants from Haiti by Householder Income Ages 45 - 64 years
In terms of householder income ages 45 - 64 years, the demographic groups most similar to Immigrants from Haiti are Immigrants from Dominica ($83,311, a difference of 0.060%), Immigrants from Bahamas ($83,177, a difference of 0.10%), Cajun ($83,015, a difference of 0.29%), Immigrants from Cabo Verde ($83,542, a difference of 0.34%), and Shoshone ($83,588, a difference of 0.40%).
| Demographics | Rating | Rank | Householder Income Ages 45 - 64 years |
| Hondurans | 0.0 /100 | #303 | Tragic $84,079 |
| Ottawa | 0.0 /100 | #304 | Tragic $83,953 |
| Chippewa | 0.0 /100 | #305 | Tragic $83,943 |
| Ute | 0.0 /100 | #306 | Tragic $83,937 |
| Shoshone | 0.0 /100 | #307 | Tragic $83,588 |
| Immigrants | Cabo Verde | 0.0 /100 | #308 | Tragic $83,542 |
| Immigrants | Dominica | 0.0 /100 | #309 | Tragic $83,311 |
| Immigrants | Haiti | 0.0 /100 | #310 | Tragic $83,257 |
| Immigrants | Bahamas | 0.0 /100 | #311 | Tragic $83,177 |
| Cajuns | 0.0 /100 | #312 | Tragic $83,015 |
| U.S. Virgin Islanders | 0.0 /100 | #313 | Tragic $82,736 |
| Immigrants | Honduras | 0.0 /100 | #314 | Tragic $82,697 |
| Paiute | 0.0 /100 | #315 | Tragic $82,629 |
| Immigrants | Caribbean | 0.0 /100 | #316 | Tragic $82,513 |
| Colville | 0.0 /100 | #317 | Tragic $82,474 |