Immigrants from South Africa vs Immigrants from Austria 1 or more Vehicles in Household
COMPARE
Immigrants from South Africa
Immigrants from Austria
1 or more Vehicles in Household
1 or more Vehicles in Household Comparison
Immigrants from South Africa
Immigrants from Austria
90.4%
1 OR MORE VEHICLES IN HOUSEHOLD
88.1/ 100
METRIC RATING
132nd/ 347
METRIC RANK
89.9%
1 OR MORE VEHICLES IN HOUSEHOLD
65.5/ 100
METRIC RATING
163rd/ 347
METRIC RANK
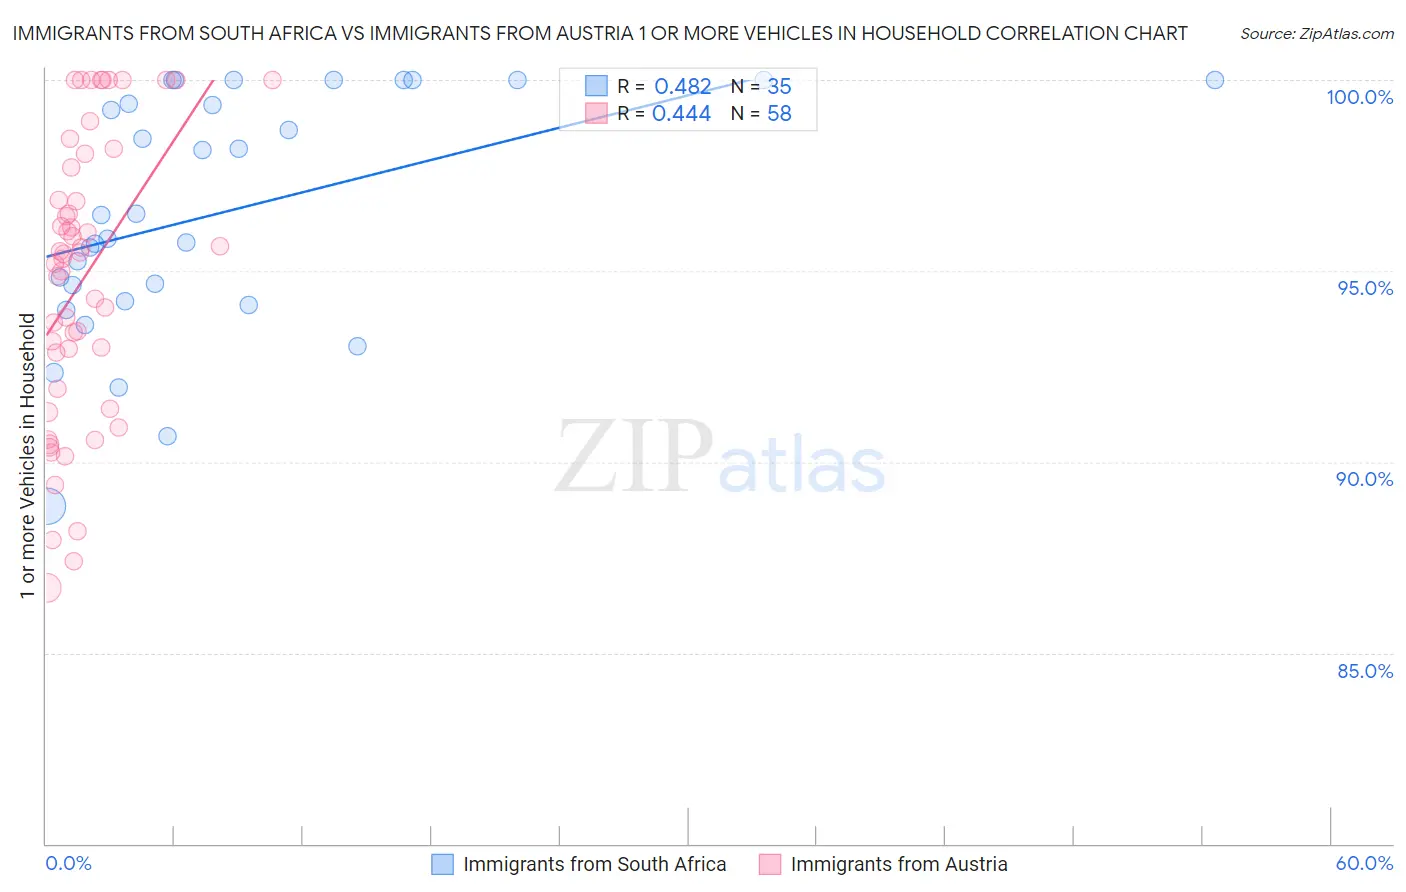
Immigrants from South Africa vs Immigrants from Austria 1 or more Vehicles in Household Correlation Chart
The statistical analysis conducted on geographies consisting of 233,272,245 people shows a moderate positive correlation between the proportion of Immigrants from South Africa and percentage of households with 1 or more vehicles available in the United States with a correlation coefficient (R) of 0.482 and weighted average of 90.4%. Similarly, the statistical analysis conducted on geographies consisting of 167,940,062 people shows a moderate positive correlation between the proportion of Immigrants from Austria and percentage of households with 1 or more vehicles available in the United States with a correlation coefficient (R) of 0.444 and weighted average of 89.9%, a difference of 0.53%.
1 or more Vehicles in Household Correlation Summary
| Measurement | Immigrants from South Africa | Immigrants from Austria |
| Minimum | 88.8% | 86.7% |
| Maximum | 100.0% | 100.0% |
| Range | 11.2% | 13.3% |
| Mean | 96.6% | 94.8% |
| Median | 96.5% | 95.4% |
| Interquartile 25% (IQ1) | 94.2% | 91.9% |
| Interquartile 75% (IQ3) | 100.0% | 97.7% |
| Interquartile Range (IQR) | 5.8% | 5.8% |
| Standard Deviation (Sample) | 3.1% | 3.7% |
| Standard Deviation (Population) | 3.1% | 3.7% |
Similar Demographics by 1 or more Vehicles in Household
Demographics Similar to Immigrants from South Africa by 1 or more Vehicles in Household
In terms of 1 or more vehicles in household, the demographic groups most similar to Immigrants from South Africa are Immigrants from Kenya (90.4%, a difference of 0.010%), Immigrants from Syria (90.4%, a difference of 0.020%), Burmese (90.4%, a difference of 0.030%), Marshallese (90.4%, a difference of 0.030%), and Nicaraguan (90.4%, a difference of 0.030%).
| Demographics | Rating | Rank | 1 or more Vehicles in Household |
| Immigrants | Korea | 90.5 /100 | #125 | Exceptional 90.5% |
| Immigrants | Cameroon | 89.4 /100 | #126 | Excellent 90.4% |
| Immigrants | Azores | 89.1 /100 | #127 | Excellent 90.4% |
| Burmese | 89.0 /100 | #128 | Excellent 90.4% |
| Marshallese | 88.9 /100 | #129 | Excellent 90.4% |
| Nicaraguans | 88.8 /100 | #130 | Excellent 90.4% |
| Immigrants | Kenya | 88.5 /100 | #131 | Excellent 90.4% |
| Immigrants | South Africa | 88.1 /100 | #132 | Excellent 90.4% |
| Immigrants | Syria | 87.5 /100 | #133 | Excellent 90.4% |
| Kenyans | 87.0 /100 | #134 | Excellent 90.4% |
| Immigrants | Oceania | 86.9 /100 | #135 | Excellent 90.4% |
| Hungarians | 86.5 /100 | #136 | Excellent 90.3% |
| Latvians | 86.3 /100 | #137 | Excellent 90.3% |
| Syrians | 86.3 /100 | #138 | Excellent 90.3% |
| Estonians | 85.6 /100 | #139 | Excellent 90.3% |
Demographics Similar to Immigrants from Austria by 1 or more Vehicles in Household
In terms of 1 or more vehicles in household, the demographic groups most similar to Immigrants from Austria are Spanish American Indian (89.9%, a difference of 0.030%), Comanche (89.9%, a difference of 0.040%), Immigrants from Saudi Arabia (89.9%, a difference of 0.050%), Immigrants from Indonesia (90.0%, a difference of 0.060%), and Salvadoran (90.0%, a difference of 0.060%).
| Demographics | Rating | Rank | 1 or more Vehicles in Household |
| Australians | 72.4 /100 | #156 | Good 90.0% |
| Immigrants | Congo | 71.2 /100 | #157 | Good 90.0% |
| Brazilians | 71.0 /100 | #158 | Good 90.0% |
| South Africans | 69.7 /100 | #159 | Good 90.0% |
| Immigrants | Indonesia | 68.8 /100 | #160 | Good 90.0% |
| Salvadorans | 68.7 /100 | #161 | Good 90.0% |
| Spanish American Indians | 67.0 /100 | #162 | Good 89.9% |
| Immigrants | Austria | 65.5 /100 | #163 | Good 89.9% |
| Comanche | 63.4 /100 | #164 | Good 89.9% |
| Immigrants | Saudi Arabia | 62.6 /100 | #165 | Good 89.9% |
| Immigrants | Middle Africa | 62.2 /100 | #166 | Good 89.9% |
| Immigrants | Latin America | 60.3 /100 | #167 | Good 89.8% |
| Immigrants | Cambodia | 60.1 /100 | #168 | Good 89.8% |
| Natives/Alaskans | 59.5 /100 | #169 | Average 89.8% |
| Immigrants | Costa Rica | 57.6 /100 | #170 | Average 89.8% |