Immigrants from South Africa vs Afghan Householder Income Under 25 years
COMPARE
Immigrants from South Africa
Afghan
Householder Income Under 25 years
Householder Income Under 25 years Comparison
Immigrants from South Africa
Afghans
$51,705
HOUSEHOLDER INCOME UNDER 25 YEARS
23.4/ 100
METRIC RATING
187th/ 347
METRIC RANK
$58,019
HOUSEHOLDER INCOME UNDER 25 YEARS
100.0/ 100
METRIC RATING
10th/ 347
METRIC RANK
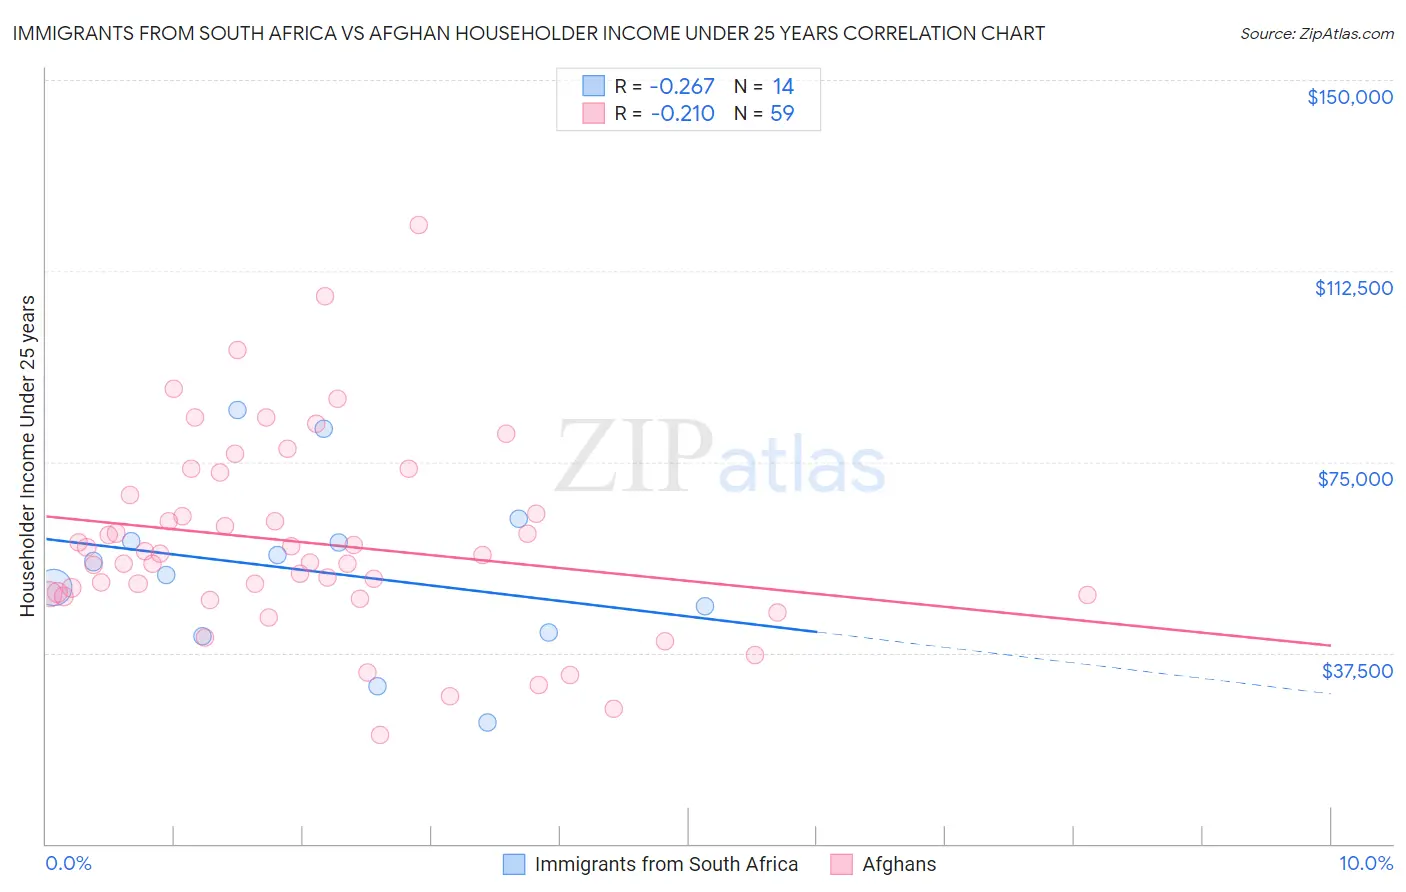
Immigrants from South Africa vs Afghan Householder Income Under 25 years Correlation Chart
The statistical analysis conducted on geographies consisting of 203,386,126 people shows a weak negative correlation between the proportion of Immigrants from South Africa and household income with householder under the age of 25 in the United States with a correlation coefficient (R) of -0.267 and weighted average of $51,705. Similarly, the statistical analysis conducted on geographies consisting of 136,529,286 people shows a weak negative correlation between the proportion of Afghans and household income with householder under the age of 25 in the United States with a correlation coefficient (R) of -0.210 and weighted average of $58,019, a difference of 12.2%.
Householder Income Under 25 years Correlation Summary
| Measurement | Immigrants from South Africa | Afghan |
| Minimum | $23,889 | $21,359 |
| Maximum | $85,165 | $121,552 |
| Range | $61,276 | $100,193 |
| Mean | $53,389 | $59,184 |
| Median | $54,131 | $56,725 |
| Interquartile 25% (IQ1) | $41,391 | $48,958 |
| Interquartile 75% (IQ3) | $59,362 | $68,385 |
| Interquartile Range (IQR) | $17,971 | $19,427 |
| Standard Deviation (Sample) | $16,934 | $19,191 |
| Standard Deviation (Population) | $16,318 | $19,028 |
Similar Demographics by Householder Income Under 25 years
Demographics Similar to Immigrants from South Africa by Householder Income Under 25 years
In terms of householder income under 25 years, the demographic groups most similar to Immigrants from South Africa are Alaskan Athabascan ($51,713, a difference of 0.020%), Northern European ($51,678, a difference of 0.050%), Immigrants from Latvia ($51,737, a difference of 0.060%), Paiute ($51,743, a difference of 0.070%), and Croatian ($51,662, a difference of 0.080%).
| Demographics | Rating | Rank | Householder Income Under 25 years |
| Immigrants | England | 28.7 /100 | #180 | Fair $51,817 |
| Europeans | 27.6 /100 | #181 | Fair $51,796 |
| Jordanians | 27.6 /100 | #182 | Fair $51,796 |
| Mexican American Indians | 27.0 /100 | #183 | Fair $51,783 |
| Paiute | 25.1 /100 | #184 | Fair $51,743 |
| Immigrants | Latvia | 24.8 /100 | #185 | Fair $51,737 |
| Alaskan Athabascans | 23.8 /100 | #186 | Fair $51,713 |
| Immigrants | South Africa | 23.4 /100 | #187 | Fair $51,705 |
| Northern Europeans | 22.2 /100 | #188 | Fair $51,678 |
| Croatians | 21.6 /100 | #189 | Fair $51,662 |
| Malaysians | 19.7 /100 | #190 | Poor $51,615 |
| Panamanians | 19.5 /100 | #191 | Poor $51,611 |
| West Indians | 18.5 /100 | #192 | Poor $51,583 |
| Immigrants | Eritrea | 18.1 /100 | #193 | Poor $51,574 |
| Guatemalans | 16.4 /100 | #194 | Poor $51,525 |
Demographics Similar to Afghans by Householder Income Under 25 years
In terms of householder income under 25 years, the demographic groups most similar to Afghans are Immigrants from China ($57,931, a difference of 0.15%), Immigrants from Philippines ($57,930, a difference of 0.15%), Chinese ($58,162, a difference of 0.25%), Immigrants from South Central Asia ($57,818, a difference of 0.35%), and Indian (Asian) ($58,239, a difference of 0.38%).
| Demographics | Rating | Rank | Householder Income Under 25 years |
| Immigrants | India | 100.0 /100 | #3 | Exceptional $59,914 |
| Immigrants | Taiwan | 100.0 /100 | #4 | Exceptional $59,424 |
| Immigrants | Bolivia | 100.0 /100 | #5 | Exceptional $59,389 |
| Thais | 100.0 /100 | #6 | Exceptional $59,187 |
| Bolivians | 100.0 /100 | #7 | Exceptional $58,506 |
| Indians (Asian) | 100.0 /100 | #8 | Exceptional $58,239 |
| Chinese | 100.0 /100 | #9 | Exceptional $58,162 |
| Afghans | 100.0 /100 | #10 | Exceptional $58,019 |
| Immigrants | China | 100.0 /100 | #11 | Exceptional $57,931 |
| Immigrants | Philippines | 100.0 /100 | #12 | Exceptional $57,930 |
| Immigrants | South Central Asia | 100.0 /100 | #13 | Exceptional $57,818 |
| Filipinos | 100.0 /100 | #14 | Exceptional $57,740 |
| Koreans | 100.0 /100 | #15 | Exceptional $57,730 |
| Immigrants | Afghanistan | 100.0 /100 | #16 | Exceptional $57,478 |
| Sierra Leoneans | 100.0 /100 | #17 | Exceptional $57,272 |