Immigrants from Sierra Leone vs Spanish American Indian Householder Income Ages 45 - 64 years
COMPARE
Immigrants from Sierra Leone
Spanish American Indian
Householder Income Ages 45 - 64 years
Householder Income Ages 45 - 64 years Comparison
Immigrants from Sierra Leone
Spanish American Indians
$103,227
HOUSEHOLDER INCOME AGES 45 - 64 YEARS
81.1/ 100
METRIC RATING
149th/ 347
METRIC RANK
$87,561
HOUSEHOLDER INCOME AGES 45 - 64 YEARS
0.2/ 100
METRIC RATING
273rd/ 347
METRIC RANK
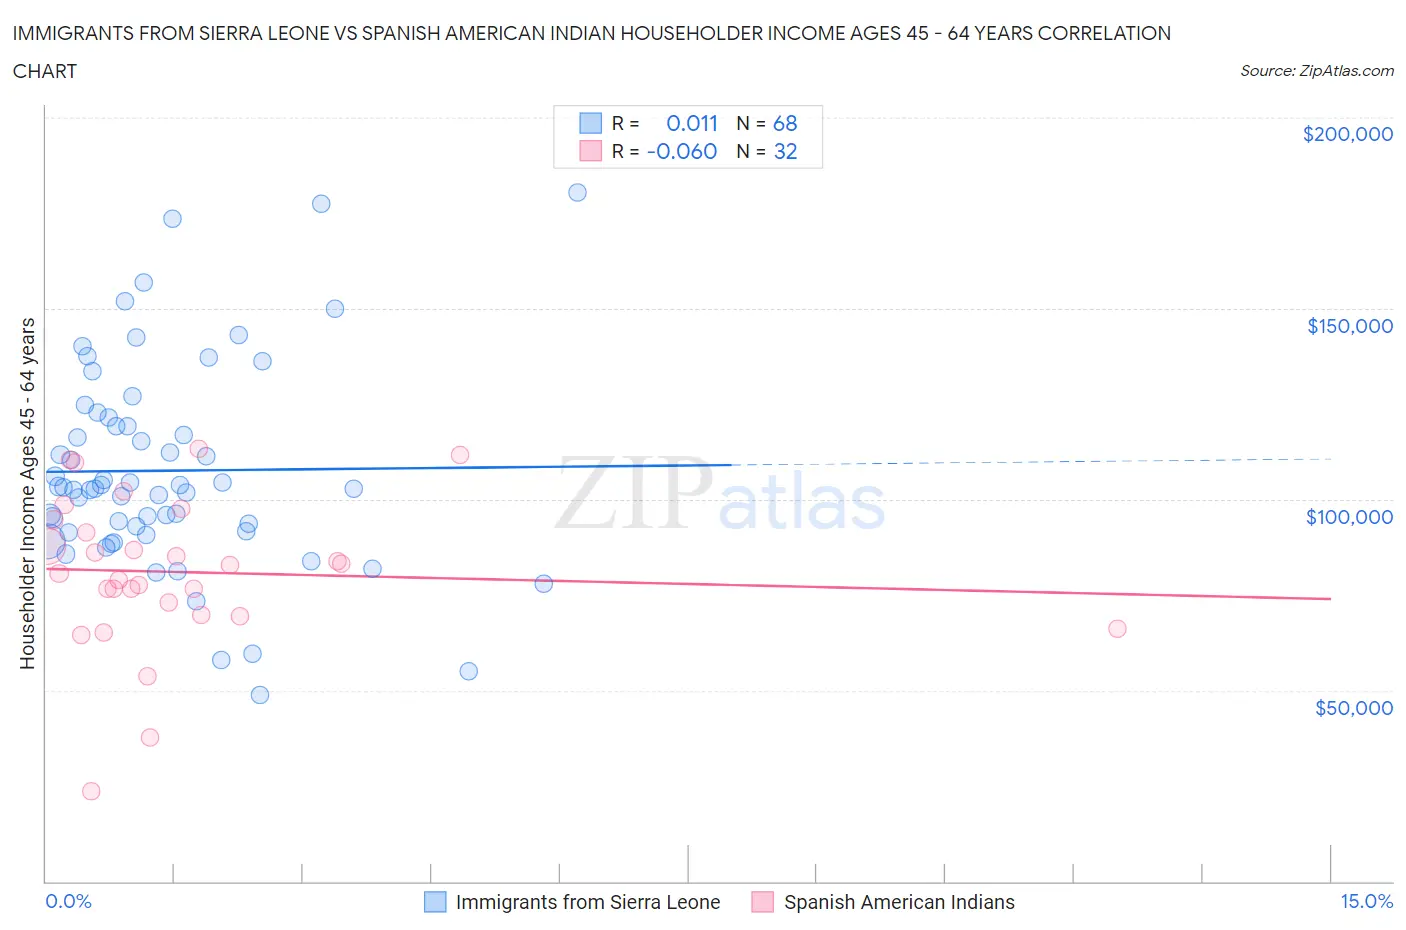
Immigrants from Sierra Leone vs Spanish American Indian Householder Income Ages 45 - 64 years Correlation Chart
The statistical analysis conducted on geographies consisting of 101,631,094 people shows no correlation between the proportion of Immigrants from Sierra Leone and household income with householder between the ages 45 and 64 in the United States with a correlation coefficient (R) of 0.011 and weighted average of $103,227. Similarly, the statistical analysis conducted on geographies consisting of 73,124,426 people shows a slight negative correlation between the proportion of Spanish American Indians and household income with householder between the ages 45 and 64 in the United States with a correlation coefficient (R) of -0.060 and weighted average of $87,561, a difference of 17.9%.
Householder Income Ages 45 - 64 years Correlation Summary
| Measurement | Immigrants from Sierra Leone | Spanish American Indian |
| Minimum | $48,831 | $23,558 |
| Maximum | $180,469 | $113,198 |
| Range | $131,638 | $89,640 |
| Mean | $107,504 | $80,973 |
| Median | $102,977 | $81,710 |
| Interquartile 25% (IQ1) | $91,548 | $71,336 |
| Interquartile 75% (IQ3) | $120,393 | $93,059 |
| Interquartile Range (IQR) | $28,845 | $21,723 |
| Standard Deviation (Sample) | $27,099 | $19,833 |
| Standard Deviation (Population) | $26,899 | $19,521 |
Similar Demographics by Householder Income Ages 45 - 64 years
Demographics Similar to Immigrants from Sierra Leone by Householder Income Ages 45 - 64 years
In terms of householder income ages 45 - 64 years, the demographic groups most similar to Immigrants from Sierra Leone are Immigrants from Germany ($103,282, a difference of 0.050%), Immigrants from Peru ($103,173, a difference of 0.050%), Basque ($103,387, a difference of 0.15%), Swiss ($103,071, a difference of 0.15%), and Irish ($103,067, a difference of 0.16%).
| Demographics | Rating | Rank | Householder Income Ages 45 - 64 years |
| Luxembourgers | 83.3 /100 | #142 | Excellent $103,536 |
| Serbians | 83.2 /100 | #143 | Excellent $103,522 |
| Czechs | 83.1 /100 | #144 | Excellent $103,507 |
| Ugandans | 82.9 /100 | #145 | Excellent $103,472 |
| Immigrants | Chile | 82.5 /100 | #146 | Excellent $103,412 |
| Basques | 82.3 /100 | #147 | Excellent $103,387 |
| Immigrants | Germany | 81.5 /100 | #148 | Excellent $103,282 |
| Immigrants | Sierra Leone | 81.1 /100 | #149 | Excellent $103,227 |
| Immigrants | Peru | 80.7 /100 | #150 | Excellent $103,173 |
| Swiss | 79.9 /100 | #151 | Good $103,071 |
| Irish | 79.8 /100 | #152 | Good $103,067 |
| Scandinavians | 79.0 /100 | #153 | Good $102,969 |
| Slovenes | 78.3 /100 | #154 | Good $102,885 |
| Costa Ricans | 77.4 /100 | #155 | Good $102,779 |
| Carpatho Rusyns | 77.4 /100 | #156 | Good $102,777 |
Demographics Similar to Spanish American Indians by Householder Income Ages 45 - 64 years
In terms of householder income ages 45 - 64 years, the demographic groups most similar to Spanish American Indians are Cape Verdean ($87,580, a difference of 0.020%), Guatemalan ($87,705, a difference of 0.16%), Immigrants from Liberia ($87,739, a difference of 0.20%), Spanish American ($87,836, a difference of 0.31%), and Immigrants from Micronesia ($87,864, a difference of 0.35%).
| Demographics | Rating | Rank | Householder Income Ages 45 - 64 years |
| Immigrants | West Indies | 0.2 /100 | #266 | Tragic $88,164 |
| Hmong | 0.2 /100 | #267 | Tragic $88,115 |
| Immigrants | Micronesia | 0.2 /100 | #268 | Tragic $87,864 |
| Spanish Americans | 0.2 /100 | #269 | Tragic $87,836 |
| Immigrants | Liberia | 0.2 /100 | #270 | Tragic $87,739 |
| Guatemalans | 0.2 /100 | #271 | Tragic $87,705 |
| Cape Verdeans | 0.2 /100 | #272 | Tragic $87,580 |
| Spanish American Indians | 0.2 /100 | #273 | Tragic $87,561 |
| Iroquois | 0.1 /100 | #274 | Tragic $87,255 |
| Immigrants | Belize | 0.1 /100 | #275 | Tragic $87,229 |
| Immigrants | Latin America | 0.1 /100 | #276 | Tragic $87,219 |
| Cree | 0.1 /100 | #277 | Tragic $87,185 |
| Immigrants | Jamaica | 0.1 /100 | #278 | Tragic $87,035 |
| Yakama | 0.1 /100 | #279 | Tragic $86,992 |
| Immigrants | Somalia | 0.1 /100 | #280 | Tragic $86,987 |