Immigrants from Sierra Leone vs Spanish American Indian In Labor Force | Age 20-24
COMPARE
Immigrants from Sierra Leone
Spanish American Indian
In Labor Force | Age 20-24
In Labor Force | Age 20-24 Comparison
Immigrants from Sierra Leone
Spanish American Indians
75.8%
IN LABOR FORCE | AGE 20-24
93.8/ 100
METRIC RATING
124th/ 347
METRIC RANK
73.7%
IN LABOR FORCE | AGE 20-24
0.8/ 100
METRIC RATING
256th/ 347
METRIC RANK
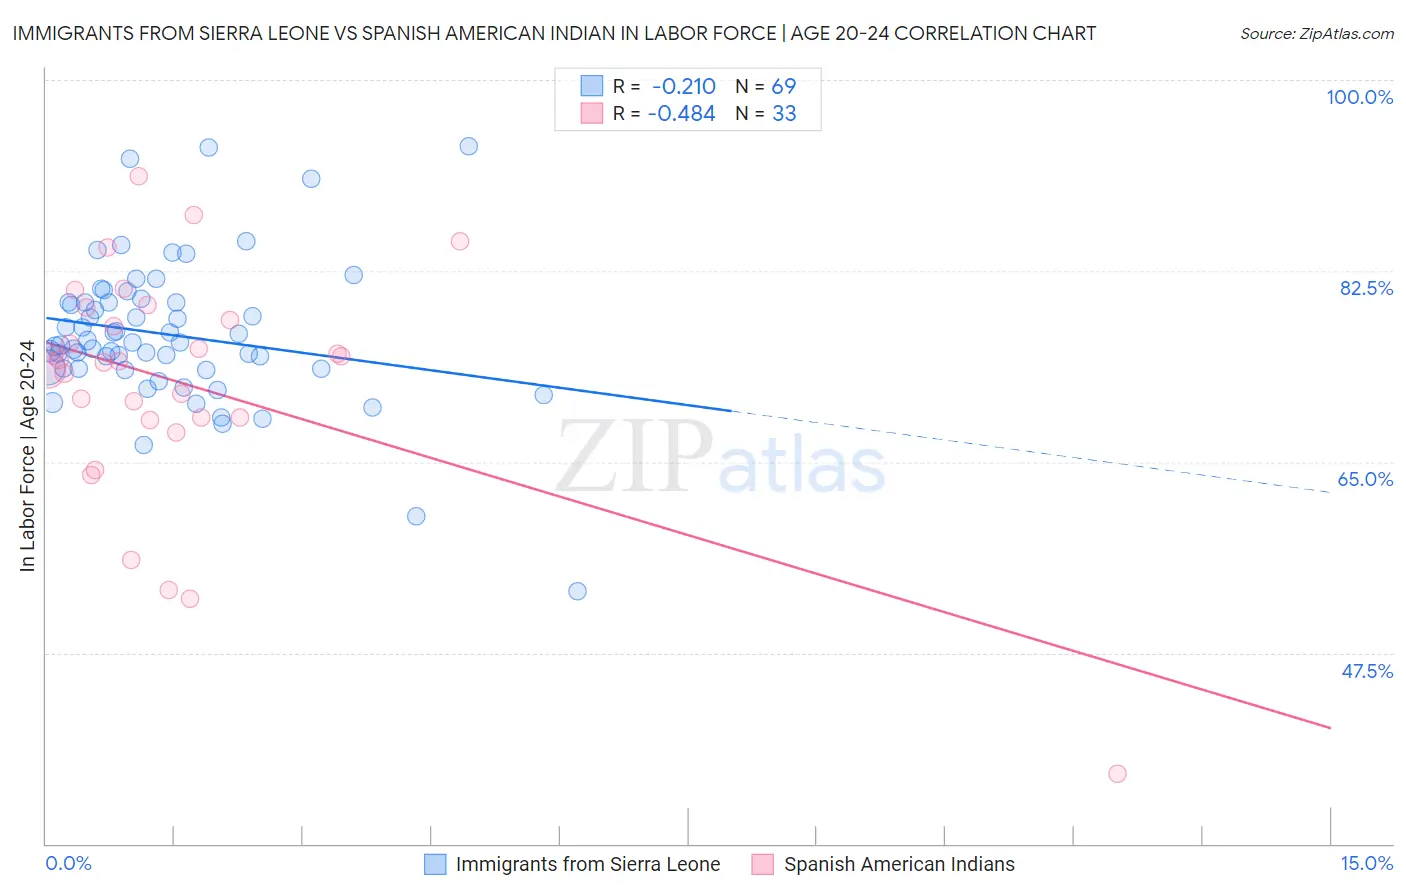
Immigrants from Sierra Leone vs Spanish American Indian In Labor Force | Age 20-24 Correlation Chart
The statistical analysis conducted on geographies consisting of 101,648,861 people shows a weak negative correlation between the proportion of Immigrants from Sierra Leone and labor force participation rate among population between the ages 20 and 24 in the United States with a correlation coefficient (R) of -0.210 and weighted average of 75.8%. Similarly, the statistical analysis conducted on geographies consisting of 73,146,145 people shows a moderate negative correlation between the proportion of Spanish American Indians and labor force participation rate among population between the ages 20 and 24 in the United States with a correlation coefficient (R) of -0.484 and weighted average of 73.7%, a difference of 2.8%.
In Labor Force | Age 20-24 Correlation Summary
| Measurement | Immigrants from Sierra Leone | Spanish American Indian |
| Minimum | 53.1% | 36.4% |
| Maximum | 93.9% | 91.1% |
| Range | 40.8% | 54.7% |
| Mean | 76.7% | 72.2% |
| Median | 75.9% | 74.2% |
| Interquartile 25% (IQ1) | 73.5% | 68.9% |
| Interquartile 75% (IQ3) | 79.6% | 78.6% |
| Interquartile Range (IQR) | 6.1% | 9.7% |
| Standard Deviation (Sample) | 6.7% | 10.8% |
| Standard Deviation (Population) | 6.6% | 10.7% |
Similar Demographics by In Labor Force | Age 20-24
Demographics Similar to Immigrants from Sierra Leone by In Labor Force | Age 20-24
In terms of in labor force | age 20-24, the demographic groups most similar to Immigrants from Sierra Leone are Immigrants from Scotland (75.8%, a difference of 0.010%), Pakistani (75.8%, a difference of 0.020%), Immigrants from Bulgaria (75.8%, a difference of 0.020%), Immigrants from Serbia (75.8%, a difference of 0.030%), and Immigrants from Africa (75.8%, a difference of 0.050%).
| Demographics | Rating | Rank | In Labor Force | Age 20-24 |
| Assyrians/Chaldeans/Syriacs | 94.9 /100 | #117 | Exceptional 75.9% |
| Spanish Americans | 94.8 /100 | #118 | Exceptional 75.8% |
| Immigrants | Portugal | 94.8 /100 | #119 | Exceptional 75.8% |
| Immigrants | Africa | 94.6 /100 | #120 | Exceptional 75.8% |
| Immigrants | Serbia | 94.3 /100 | #121 | Exceptional 75.8% |
| Pakistanis | 94.1 /100 | #122 | Exceptional 75.8% |
| Immigrants | Bulgaria | 94.1 /100 | #123 | Exceptional 75.8% |
| Immigrants | Sierra Leone | 93.8 /100 | #124 | Exceptional 75.8% |
| Immigrants | Scotland | 93.7 /100 | #125 | Exceptional 75.8% |
| Brazilians | 93.0 /100 | #126 | Exceptional 75.8% |
| Sub-Saharan Africans | 90.9 /100 | #127 | Exceptional 75.7% |
| Immigrants | Afghanistan | 89.4 /100 | #128 | Excellent 75.6% |
| Iroquois | 89.1 /100 | #129 | Excellent 75.6% |
| Immigrants | Austria | 88.8 /100 | #130 | Excellent 75.6% |
| Immigrants | Jordan | 88.5 /100 | #131 | Excellent 75.6% |
Demographics Similar to Spanish American Indians by In Labor Force | Age 20-24
In terms of in labor force | age 20-24, the demographic groups most similar to Spanish American Indians are Paraguayan (73.7%, a difference of 0.020%), Immigrants from Pakistan (73.8%, a difference of 0.040%), Egyptian (73.7%, a difference of 0.060%), Arapaho (73.8%, a difference of 0.070%), and Ute (73.8%, a difference of 0.070%).
| Demographics | Rating | Rank | In Labor Force | Age 20-24 |
| Blacks/African Americans | 1.3 /100 | #249 | Tragic 73.9% |
| Immigrants | Belgium | 1.3 /100 | #250 | Tragic 73.9% |
| Immigrants | Egypt | 1.2 /100 | #251 | Tragic 73.8% |
| Immigrants | Kazakhstan | 1.1 /100 | #252 | Tragic 73.8% |
| Arapaho | 1.0 /100 | #253 | Tragic 73.8% |
| Ute | 1.0 /100 | #254 | Tragic 73.8% |
| Immigrants | Pakistan | 0.9 /100 | #255 | Tragic 73.8% |
| Spanish American Indians | 0.8 /100 | #256 | Tragic 73.7% |
| Paraguayans | 0.8 /100 | #257 | Tragic 73.7% |
| Egyptians | 0.7 /100 | #258 | Tragic 73.7% |
| Dutch West Indians | 0.7 /100 | #259 | Tragic 73.7% |
| Immigrants | Turkey | 0.7 /100 | #260 | Tragic 73.7% |
| Houma | 0.6 /100 | #261 | Tragic 73.7% |
| Asians | 0.6 /100 | #262 | Tragic 73.7% |
| Immigrants | Asia | 0.5 /100 | #263 | Tragic 73.6% |