Immigrants from Sierra Leone vs Sierra Leonean Median Female Earnings
COMPARE
Immigrants from Sierra Leone
Sierra Leonean
Median Female Earnings
Median Female Earnings Comparison
Immigrants from Sierra Leone
Sierra Leoneans
$42,214
MEDIAN FEMALE EARNINGS
99.5/ 100
METRIC RATING
83rd/ 347
METRIC RANK
$42,868
MEDIAN FEMALE EARNINGS
99.9/ 100
METRIC RATING
65th/ 347
METRIC RANK
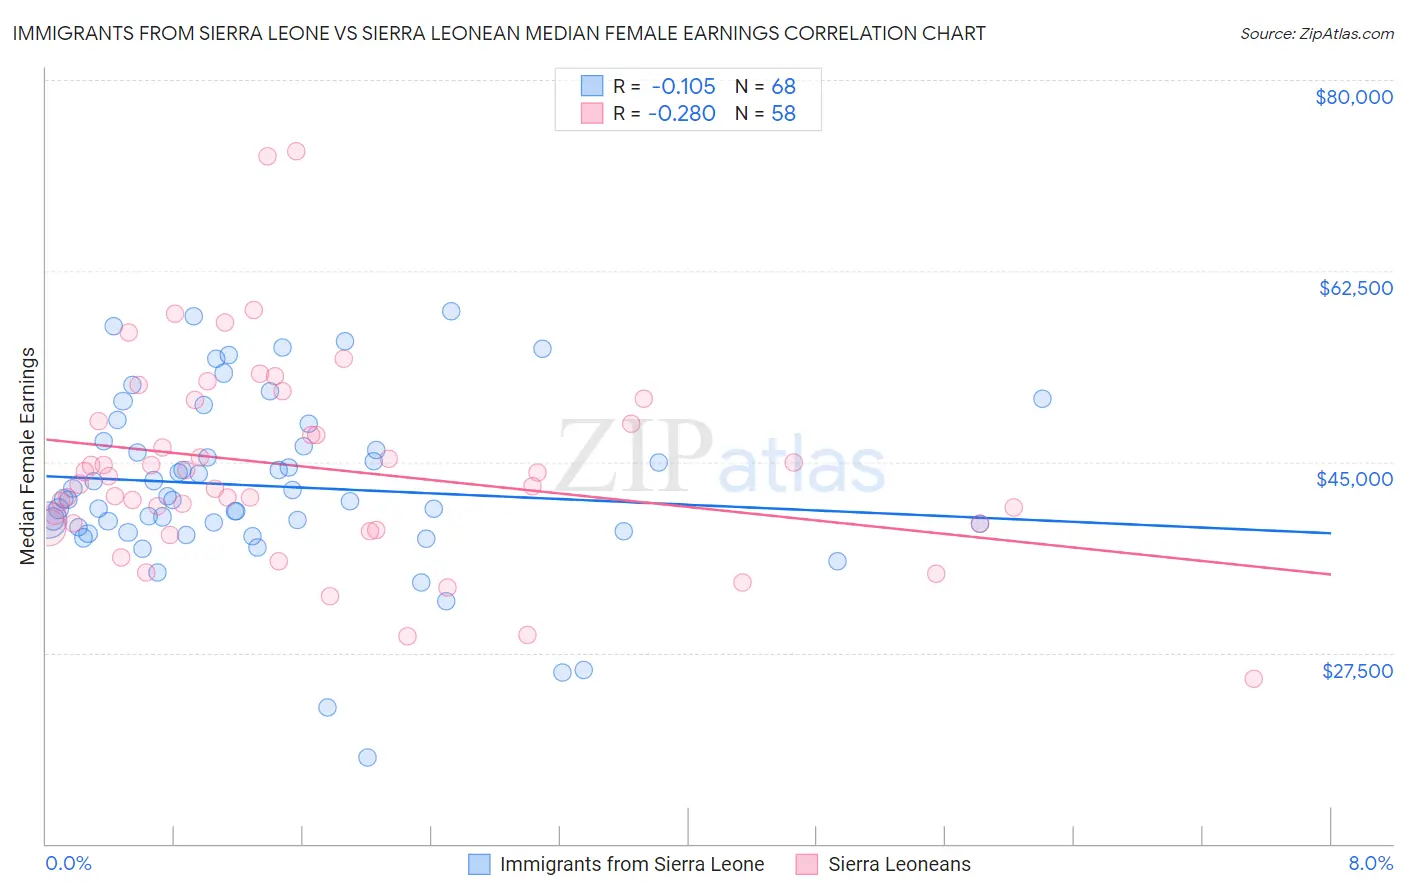
Immigrants from Sierra Leone vs Sierra Leonean Median Female Earnings Correlation Chart
The statistical analysis conducted on geographies consisting of 101,627,832 people shows a poor negative correlation between the proportion of Immigrants from Sierra Leone and median female earnings in the United States with a correlation coefficient (R) of -0.105 and weighted average of $42,214. Similarly, the statistical analysis conducted on geographies consisting of 83,345,835 people shows a weak negative correlation between the proportion of Sierra Leoneans and median female earnings in the United States with a correlation coefficient (R) of -0.280 and weighted average of $42,868, a difference of 1.5%.
Median Female Earnings Correlation Summary
| Measurement | Immigrants from Sierra Leone | Sierra Leonean |
| Minimum | $17,869 | $25,167 |
| Maximum | $58,839 | $73,523 |
| Range | $40,970 | $48,356 |
| Mean | $42,763 | $44,483 |
| Median | $41,611 | $43,304 |
| Interquartile 25% (IQ1) | $38,837 | $39,290 |
| Interquartile 75% (IQ3) | $46,686 | $48,705 |
| Interquartile Range (IQR) | $7,849 | $9,415 |
| Standard Deviation (Sample) | $8,036 | $9,174 |
| Standard Deviation (Population) | $7,977 | $9,094 |
Demographics Similar to Immigrants from Sierra Leone and Sierra Leoneans by Median Female Earnings
In terms of median female earnings, the demographic groups most similar to Immigrants from Sierra Leone are Armenian ($42,212, a difference of 0.010%), Immigrants from Morocco ($42,229, a difference of 0.030%), Immigrants from Southern Europe ($42,275, a difference of 0.14%), Immigrants from Moldova ($42,304, a difference of 0.21%), and Greek ($42,336, a difference of 0.29%). Similarly, the demographic groups most similar to Sierra Leoneans are Immigrants from Norway ($42,837, a difference of 0.070%), Immigrants from Egypt ($42,837, a difference of 0.070%), Immigrants from Austria ($42,824, a difference of 0.10%), Immigrants from Spain ($42,815, a difference of 0.12%), and Immigrants from Ethiopia ($42,744, a difference of 0.29%).
| Demographics | Rating | Rank | Median Female Earnings |
| Immigrants | Pakistan | 99.9 /100 | #64 | Exceptional $43,052 |
| Sierra Leoneans | 99.9 /100 | #65 | Exceptional $42,868 |
| Immigrants | Norway | 99.9 /100 | #66 | Exceptional $42,837 |
| Immigrants | Egypt | 99.9 /100 | #67 | Exceptional $42,837 |
| Immigrants | Austria | 99.8 /100 | #68 | Exceptional $42,824 |
| Immigrants | Spain | 99.8 /100 | #69 | Exceptional $42,815 |
| Immigrants | Ethiopia | 99.8 /100 | #70 | Exceptional $42,744 |
| Immigrants | Romania | 99.8 /100 | #71 | Exceptional $42,718 |
| Albanians | 99.8 /100 | #72 | Exceptional $42,584 |
| Mongolians | 99.7 /100 | #73 | Exceptional $42,542 |
| Immigrants | South Africa | 99.7 /100 | #74 | Exceptional $42,508 |
| New Zealanders | 99.7 /100 | #75 | Exceptional $42,446 |
| Immigrants | Italy | 99.7 /100 | #76 | Exceptional $42,446 |
| Immigrants | Albania | 99.6 /100 | #77 | Exceptional $42,388 |
| Immigrants | Kazakhstan | 99.6 /100 | #78 | Exceptional $42,386 |
| Greeks | 99.6 /100 | #79 | Exceptional $42,336 |
| Immigrants | Moldova | 99.6 /100 | #80 | Exceptional $42,304 |
| Immigrants | Southern Europe | 99.5 /100 | #81 | Exceptional $42,275 |
| Immigrants | Morocco | 99.5 /100 | #82 | Exceptional $42,229 |
| Immigrants | Sierra Leone | 99.5 /100 | #83 | Exceptional $42,214 |
| Armenians | 99.5 /100 | #84 | Exceptional $42,212 |