Immigrants from Sierra Leone vs Chippewa Median Female Earnings
COMPARE
Immigrants from Sierra Leone
Chippewa
Median Female Earnings
Median Female Earnings Comparison
Immigrants from Sierra Leone
Chippewa
$42,214
MEDIAN FEMALE EARNINGS
99.5/ 100
METRIC RATING
83rd/ 347
METRIC RANK
$35,003
MEDIAN FEMALE EARNINGS
0.0/ 100
METRIC RATING
310th/ 347
METRIC RANK
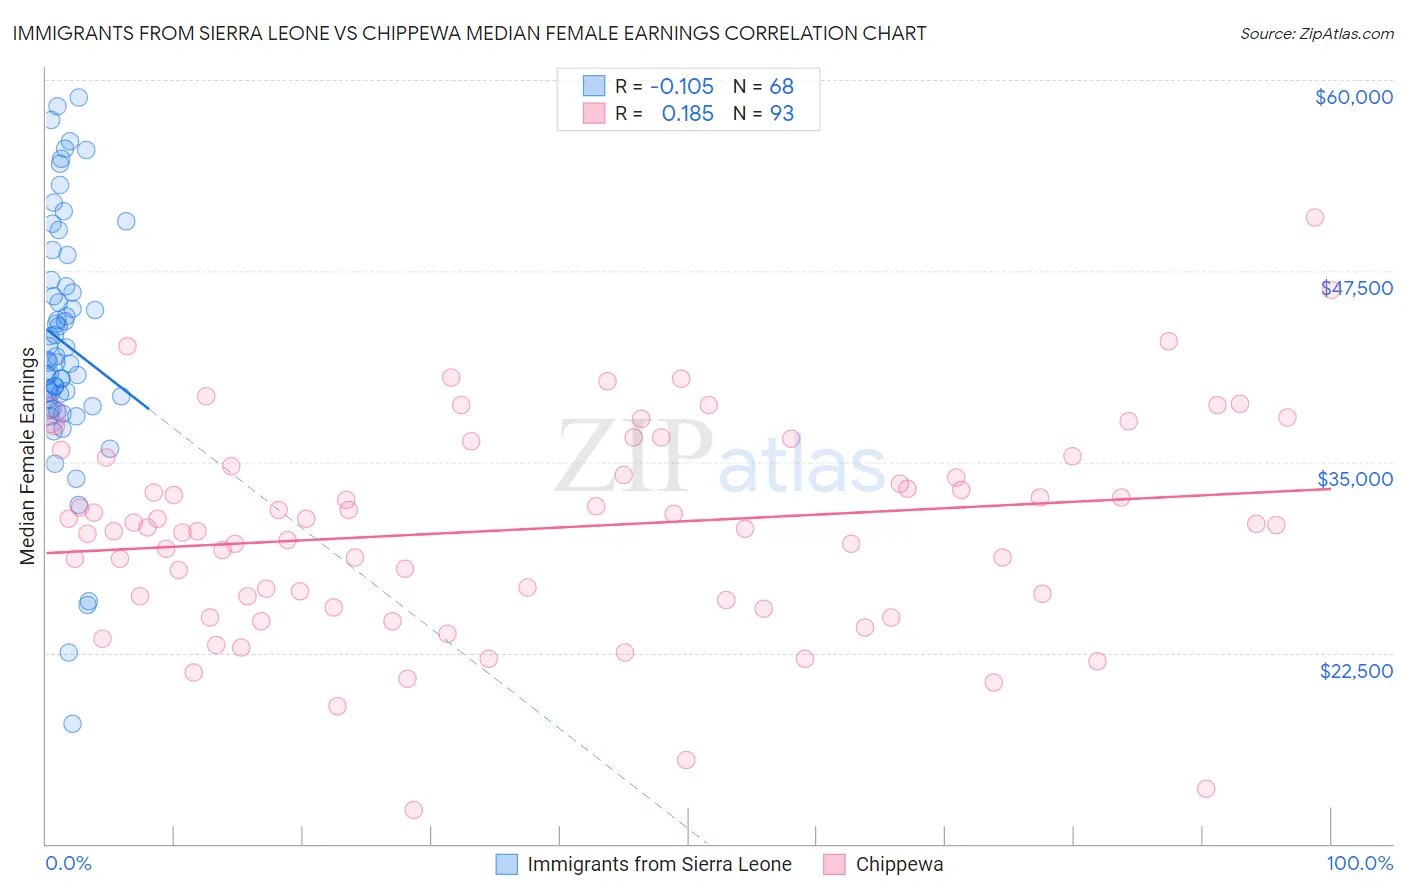
Immigrants from Sierra Leone vs Chippewa Median Female Earnings Correlation Chart
The statistical analysis conducted on geographies consisting of 101,627,832 people shows a poor negative correlation between the proportion of Immigrants from Sierra Leone and median female earnings in the United States with a correlation coefficient (R) of -0.105 and weighted average of $42,214. Similarly, the statistical analysis conducted on geographies consisting of 214,968,178 people shows a poor positive correlation between the proportion of Chippewa and median female earnings in the United States with a correlation coefficient (R) of 0.185 and weighted average of $35,003, a difference of 20.6%.
Median Female Earnings Correlation Summary
| Measurement | Immigrants from Sierra Leone | Chippewa |
| Minimum | $17,869 | $12,188 |
| Maximum | $58,839 | $50,958 |
| Range | $40,970 | $38,770 |
| Mean | $42,763 | $30,628 |
| Median | $41,611 | $30,893 |
| Interquartile 25% (IQ1) | $38,837 | $26,067 |
| Interquartile 75% (IQ3) | $46,686 | $35,324 |
| Interquartile Range (IQR) | $7,849 | $9,258 |
| Standard Deviation (Sample) | $8,036 | $6,851 |
| Standard Deviation (Population) | $7,977 | $6,814 |
Similar Demographics by Median Female Earnings
Demographics Similar to Immigrants from Sierra Leone by Median Female Earnings
In terms of median female earnings, the demographic groups most similar to Immigrants from Sierra Leone are Armenian ($42,212, a difference of 0.010%), Immigrants from Morocco ($42,229, a difference of 0.030%), Immigrants from Southern Europe ($42,275, a difference of 0.14%), Laotian ($42,133, a difference of 0.19%), and Immigrants from Moldova ($42,304, a difference of 0.21%).
| Demographics | Rating | Rank | Median Female Earnings |
| Immigrants | Italy | 99.7 /100 | #76 | Exceptional $42,446 |
| Immigrants | Albania | 99.6 /100 | #77 | Exceptional $42,388 |
| Immigrants | Kazakhstan | 99.6 /100 | #78 | Exceptional $42,386 |
| Greeks | 99.6 /100 | #79 | Exceptional $42,336 |
| Immigrants | Moldova | 99.6 /100 | #80 | Exceptional $42,304 |
| Immigrants | Southern Europe | 99.5 /100 | #81 | Exceptional $42,275 |
| Immigrants | Morocco | 99.5 /100 | #82 | Exceptional $42,229 |
| Immigrants | Sierra Leone | 99.5 /100 | #83 | Exceptional $42,214 |
| Armenians | 99.5 /100 | #84 | Exceptional $42,212 |
| Laotians | 99.4 /100 | #85 | Exceptional $42,133 |
| Immigrants | St. Vincent and the Grenadines | 99.3 /100 | #86 | Exceptional $42,108 |
| Lithuanians | 99.3 /100 | #87 | Exceptional $42,108 |
| Immigrants | Northern Africa | 99.3 /100 | #88 | Exceptional $42,084 |
| Immigrants | Afghanistan | 99.3 /100 | #89 | Exceptional $42,055 |
| Ukrainians | 99.2 /100 | #90 | Exceptional $42,015 |
Demographics Similar to Chippewa by Median Female Earnings
In terms of median female earnings, the demographic groups most similar to Chippewa are Honduran ($35,013, a difference of 0.030%), Immigrants from Bahamas ($35,027, a difference of 0.070%), Ute ($34,960, a difference of 0.12%), Sioux ($35,063, a difference of 0.17%), and Yaqui ($34,943, a difference of 0.17%).
| Demographics | Rating | Rank | Median Female Earnings |
| Immigrants | Latin America | 0.0 /100 | #303 | Tragic $35,307 |
| Crow | 0.0 /100 | #304 | Tragic $35,266 |
| Bahamians | 0.0 /100 | #305 | Tragic $35,125 |
| Fijians | 0.0 /100 | #306 | Tragic $35,114 |
| Sioux | 0.0 /100 | #307 | Tragic $35,063 |
| Immigrants | Bahamas | 0.0 /100 | #308 | Tragic $35,027 |
| Hondurans | 0.0 /100 | #309 | Tragic $35,013 |
| Chippewa | 0.0 /100 | #310 | Tragic $35,003 |
| Ute | 0.0 /100 | #311 | Tragic $34,960 |
| Yaqui | 0.0 /100 | #312 | Tragic $34,943 |
| Cubans | 0.0 /100 | #313 | Tragic $34,942 |
| Apache | 0.0 /100 | #314 | Tragic $34,895 |
| Pennsylvania Germans | 0.0 /100 | #315 | Tragic $34,802 |
| Cherokee | 0.0 /100 | #316 | Tragic $34,742 |
| Potawatomi | 0.0 /100 | #317 | Tragic $34,739 |