Immigrants from Serbia vs Immigrants from Senegal Householder Income Over 65 years
COMPARE
Immigrants from Serbia
Immigrants from Senegal
Householder Income Over 65 years
Householder Income Over 65 years Comparison
Immigrants from Serbia
Immigrants from Senegal
$63,387
HOUSEHOLDER INCOME OVER 65 YEARS
92.7/ 100
METRIC RATING
113th/ 347
METRIC RANK
$54,447
HOUSEHOLDER INCOME OVER 65 YEARS
0.1/ 100
METRIC RATING
270th/ 347
METRIC RANK
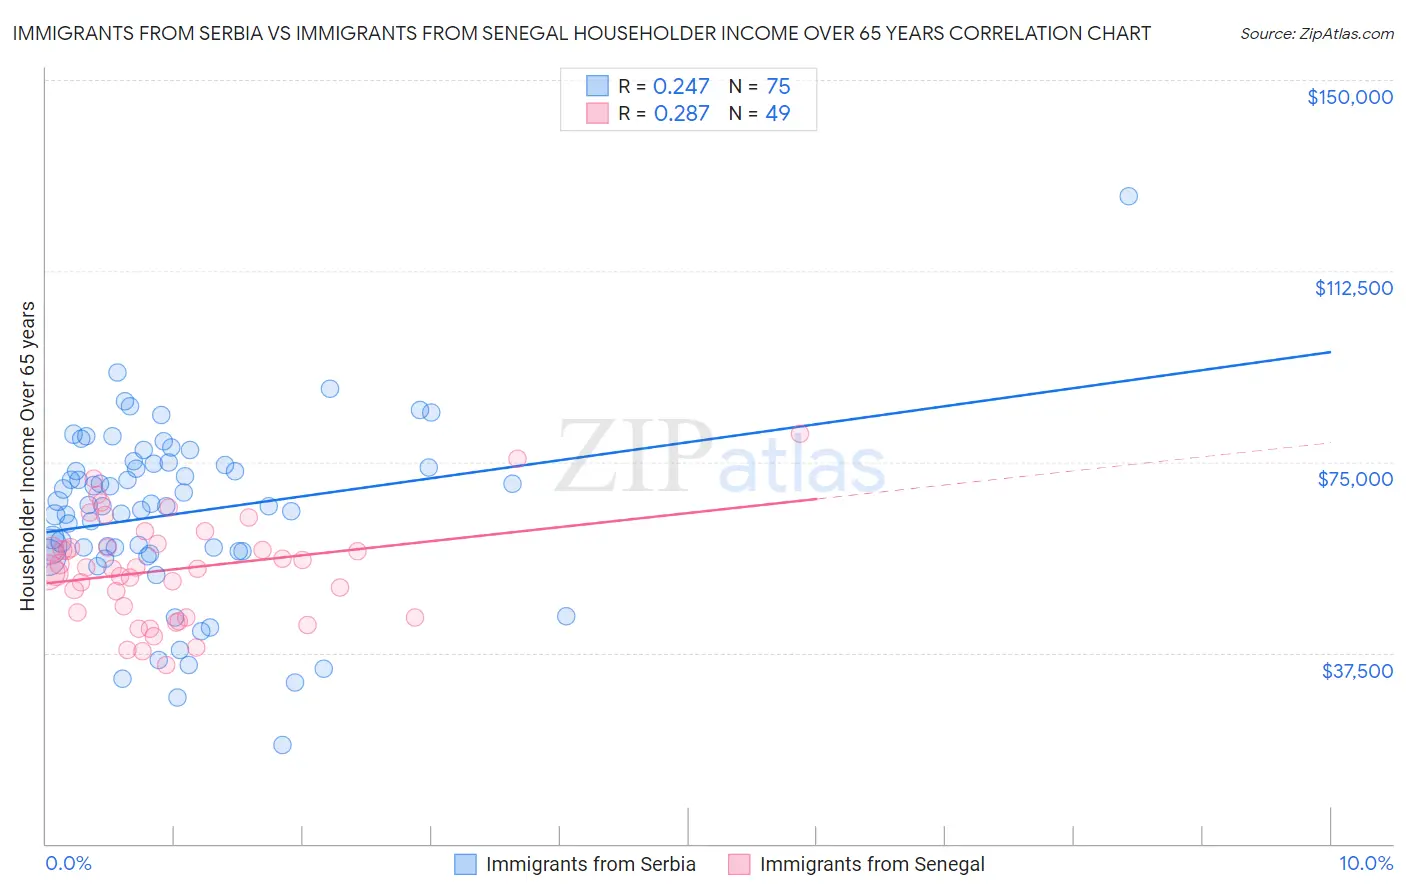
Immigrants from Serbia vs Immigrants from Senegal Householder Income Over 65 years Correlation Chart
The statistical analysis conducted on geographies consisting of 131,644,456 people shows a weak positive correlation between the proportion of Immigrants from Serbia and household income with householder over the age of 65 in the United States with a correlation coefficient (R) of 0.247 and weighted average of $63,387. Similarly, the statistical analysis conducted on geographies consisting of 90,018,715 people shows a weak positive correlation between the proportion of Immigrants from Senegal and household income with householder over the age of 65 in the United States with a correlation coefficient (R) of 0.287 and weighted average of $54,447, a difference of 16.4%.
Householder Income Over 65 years Correlation Summary
| Measurement | Immigrants from Serbia | Immigrants from Senegal |
| Minimum | $19,307 | $35,208 |
| Maximum | $127,250 | $80,537 |
| Range | $107,943 | $45,329 |
| Mean | $64,869 | $53,928 |
| Median | $66,375 | $54,081 |
| Interquartile 25% (IQ1) | $57,419 | $44,902 |
| Interquartile 75% (IQ3) | $74,688 | $58,588 |
| Interquartile Range (IQR) | $17,269 | $13,686 |
| Standard Deviation (Sample) | $17,146 | $10,096 |
| Standard Deviation (Population) | $17,032 | $9,992 |
Similar Demographics by Householder Income Over 65 years
Demographics Similar to Immigrants from Serbia by Householder Income Over 65 years
In terms of householder income over 65 years, the demographic groups most similar to Immigrants from Serbia are Immigrants from Saudi Arabia ($63,355, a difference of 0.050%), Syrian ($63,494, a difference of 0.17%), Immigrants from Spain ($63,540, a difference of 0.24%), Croatian ($63,225, a difference of 0.26%), and Guamanian/Chamorro ($63,187, a difference of 0.32%).
| Demographics | Rating | Rank | Householder Income Over 65 years |
| Immigrants | Argentina | 95.5 /100 | #106 | Exceptional $63,885 |
| Pakistanis | 95.3 /100 | #107 | Exceptional $63,844 |
| Palestinians | 95.1 /100 | #108 | Exceptional $63,800 |
| Europeans | 95.0 /100 | #109 | Exceptional $63,779 |
| Immigrants | Zimbabwe | 94.3 /100 | #110 | Exceptional $63,643 |
| Immigrants | Spain | 93.7 /100 | #111 | Exceptional $63,540 |
| Syrians | 93.4 /100 | #112 | Exceptional $63,494 |
| Immigrants | Serbia | 92.7 /100 | #113 | Exceptional $63,387 |
| Immigrants | Saudi Arabia | 92.4 /100 | #114 | Exceptional $63,355 |
| Croatians | 91.4 /100 | #115 | Exceptional $63,225 |
| Guamanians/Chamorros | 91.1 /100 | #116 | Exceptional $63,187 |
| Immigrants | Croatia | 90.9 /100 | #117 | Exceptional $63,168 |
| Danes | 90.5 /100 | #118 | Exceptional $63,117 |
| Immigrants | Jordan | 89.8 /100 | #119 | Excellent $63,041 |
| Ukrainians | 89.7 /100 | #120 | Excellent $63,032 |
Demographics Similar to Immigrants from Senegal by Householder Income Over 65 years
In terms of householder income over 65 years, the demographic groups most similar to Immigrants from Senegal are Nicaraguan ($54,474, a difference of 0.050%), Immigrants from Zaire ($54,512, a difference of 0.12%), Guatemalan ($54,526, a difference of 0.15%), Liberian ($54,356, a difference of 0.17%), and Jamaican ($54,560, a difference of 0.21%).
| Demographics | Rating | Rank | Householder Income Over 65 years |
| French American Indians | 0.1 /100 | #263 | Tragic $54,699 |
| Apache | 0.1 /100 | #264 | Tragic $54,668 |
| Belizeans | 0.1 /100 | #265 | Tragic $54,580 |
| Jamaicans | 0.1 /100 | #266 | Tragic $54,560 |
| Guatemalans | 0.1 /100 | #267 | Tragic $54,526 |
| Immigrants | Zaire | 0.1 /100 | #268 | Tragic $54,512 |
| Nicaraguans | 0.1 /100 | #269 | Tragic $54,474 |
| Immigrants | Senegal | 0.1 /100 | #270 | Tragic $54,447 |
| Liberians | 0.1 /100 | #271 | Tragic $54,356 |
| Potawatomi | 0.1 /100 | #272 | Tragic $54,212 |
| Indonesians | 0.1 /100 | #273 | Tragic $54,176 |
| Barbadians | 0.1 /100 | #274 | Tragic $54,163 |
| Cherokee | 0.1 /100 | #275 | Tragic $54,133 |
| Cree | 0.1 /100 | #276 | Tragic $54,129 |
| Cheyenne | 0.1 /100 | #277 | Tragic $54,096 |