Peruvian vs Yugoslavian Householder Income Ages 25 - 44 years
COMPARE
Peruvian
Yugoslavian
Householder Income Ages 25 - 44 years
Householder Income Ages 25 - 44 years Comparison
Peruvians
Yugoslavians
$98,886
HOUSEHOLDER INCOME AGES 25 - 44 YEARS
91.7/ 100
METRIC RATING
121st/ 347
METRIC RANK
$91,368
HOUSEHOLDER INCOME AGES 25 - 44 YEARS
14.5/ 100
METRIC RATING
207th/ 347
METRIC RANK
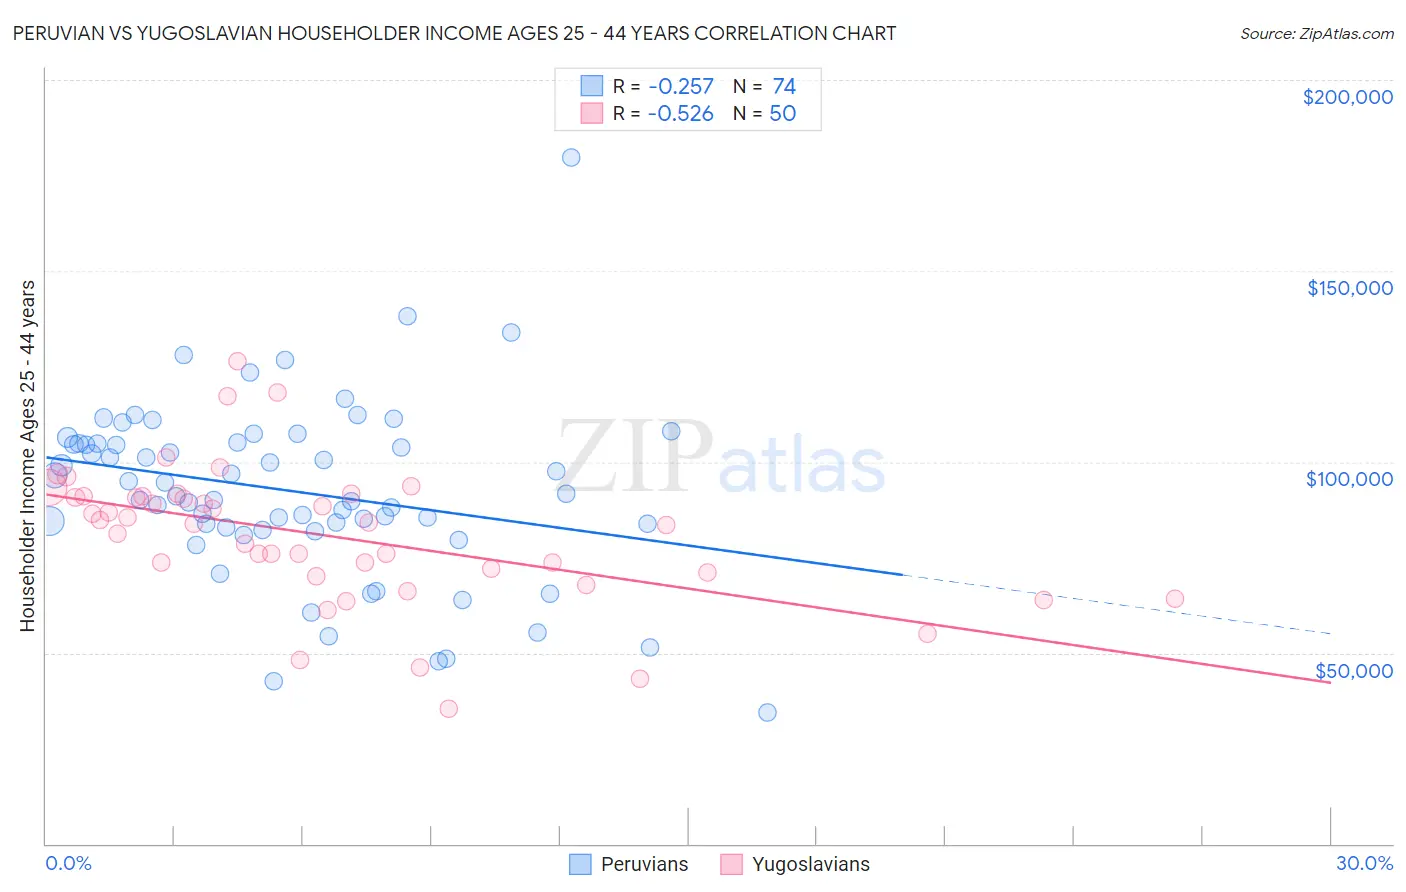
Peruvian vs Yugoslavian Householder Income Ages 25 - 44 years Correlation Chart
The statistical analysis conducted on geographies consisting of 362,388,350 people shows a weak negative correlation between the proportion of Peruvians and household income with householder between the ages 25 and 44 in the United States with a correlation coefficient (R) of -0.257 and weighted average of $98,886. Similarly, the statistical analysis conducted on geographies consisting of 285,145,495 people shows a substantial negative correlation between the proportion of Yugoslavians and household income with householder between the ages 25 and 44 in the United States with a correlation coefficient (R) of -0.526 and weighted average of $91,368, a difference of 8.2%.
Householder Income Ages 25 - 44 years Correlation Summary
| Measurement | Peruvian | Yugoslavian |
| Minimum | $34,268 | $35,313 |
| Maximum | $179,830 | $126,461 |
| Range | $145,562 | $91,148 |
| Mean | $92,331 | $80,797 |
| Median | $91,247 | $83,915 |
| Interquartile 25% (IQ1) | $82,833 | $71,042 |
| Interquartile 75% (IQ3) | $104,839 | $90,884 |
| Interquartile Range (IQR) | $22,006 | $19,842 |
| Standard Deviation (Sample) | $23,482 | $18,085 |
| Standard Deviation (Population) | $23,323 | $17,903 |
Similar Demographics by Householder Income Ages 25 - 44 years
Demographics Similar to Peruvians by Householder Income Ages 25 - 44 years
In terms of householder income ages 25 - 44 years, the demographic groups most similar to Peruvians are Immigrants from Uzbekistan ($98,849, a difference of 0.040%), Palestinian ($98,777, a difference of 0.11%), Swedish ($99,136, a difference of 0.25%), Jordanian ($99,186, a difference of 0.30%), and Zimbabwean ($98,586, a difference of 0.30%).
| Demographics | Rating | Rank | Householder Income Ages 25 - 44 years |
| Immigrants | Western Asia | 94.0 /100 | #114 | Exceptional $99,516 |
| Carpatho Rusyns | 93.7 /100 | #115 | Exceptional $99,449 |
| Portuguese | 93.7 /100 | #116 | Exceptional $99,429 |
| Immigrants | Northern Africa | 93.0 /100 | #117 | Exceptional $99,232 |
| Syrians | 92.9 /100 | #118 | Exceptional $99,215 |
| Jordanians | 92.8 /100 | #119 | Exceptional $99,186 |
| Swedes | 92.7 /100 | #120 | Exceptional $99,136 |
| Peruvians | 91.7 /100 | #121 | Exceptional $98,886 |
| Immigrants | Uzbekistan | 91.5 /100 | #122 | Exceptional $98,849 |
| Palestinians | 91.2 /100 | #123 | Exceptional $98,777 |
| Zimbabweans | 90.3 /100 | #124 | Exceptional $98,586 |
| Pakistanis | 89.3 /100 | #125 | Excellent $98,401 |
| British | 89.1 /100 | #126 | Excellent $98,359 |
| Serbians | 88.9 /100 | #127 | Excellent $98,320 |
| Europeans | 88.9 /100 | #128 | Excellent $98,310 |
Demographics Similar to Yugoslavians by Householder Income Ages 25 - 44 years
In terms of householder income ages 25 - 44 years, the demographic groups most similar to Yugoslavians are Aleut ($91,370, a difference of 0.0%), Immigrants from Thailand ($91,337, a difference of 0.030%), Immigrants from Eastern Africa ($91,458, a difference of 0.10%), Nepalese ($91,498, a difference of 0.14%), and Immigrants from Cambodia ($91,533, a difference of 0.18%).
| Demographics | Rating | Rank | Householder Income Ages 25 - 44 years |
| Whites/Caucasians | 16.7 /100 | #200 | Poor $91,668 |
| Japanese | 16.4 /100 | #201 | Poor $91,624 |
| Ecuadorians | 16.0 /100 | #202 | Poor $91,574 |
| Immigrants | Cambodia | 15.7 /100 | #203 | Poor $91,533 |
| Nepalese | 15.4 /100 | #204 | Poor $91,498 |
| Immigrants | Eastern Africa | 15.2 /100 | #205 | Poor $91,458 |
| Aleuts | 14.5 /100 | #206 | Poor $91,370 |
| Yugoslavians | 14.5 /100 | #207 | Poor $91,368 |
| Immigrants | Thailand | 14.3 /100 | #208 | Poor $91,337 |
| Immigrants | Uruguay | 13.2 /100 | #209 | Poor $91,171 |
| Immigrants | Kenya | 10.9 /100 | #210 | Poor $90,767 |
| Iraqis | 10.8 /100 | #211 | Poor $90,764 |
| Hawaiians | 10.6 /100 | #212 | Poor $90,722 |
| Immigrants | Bangladesh | 9.3 /100 | #213 | Tragic $90,448 |
| Immigrants | Africa | 8.9 /100 | #214 | Tragic $90,372 |