Ottawa vs Yugoslavian Householder Income Ages 25 - 44 years
COMPARE
Ottawa
Yugoslavian
Householder Income Ages 25 - 44 years
Householder Income Ages 25 - 44 years Comparison
Ottawa
Yugoslavians
$79,012
HOUSEHOLDER INCOME AGES 25 - 44 YEARS
0.0/ 100
METRIC RATING
315th/ 347
METRIC RANK
$91,368
HOUSEHOLDER INCOME AGES 25 - 44 YEARS
14.5/ 100
METRIC RATING
207th/ 347
METRIC RANK
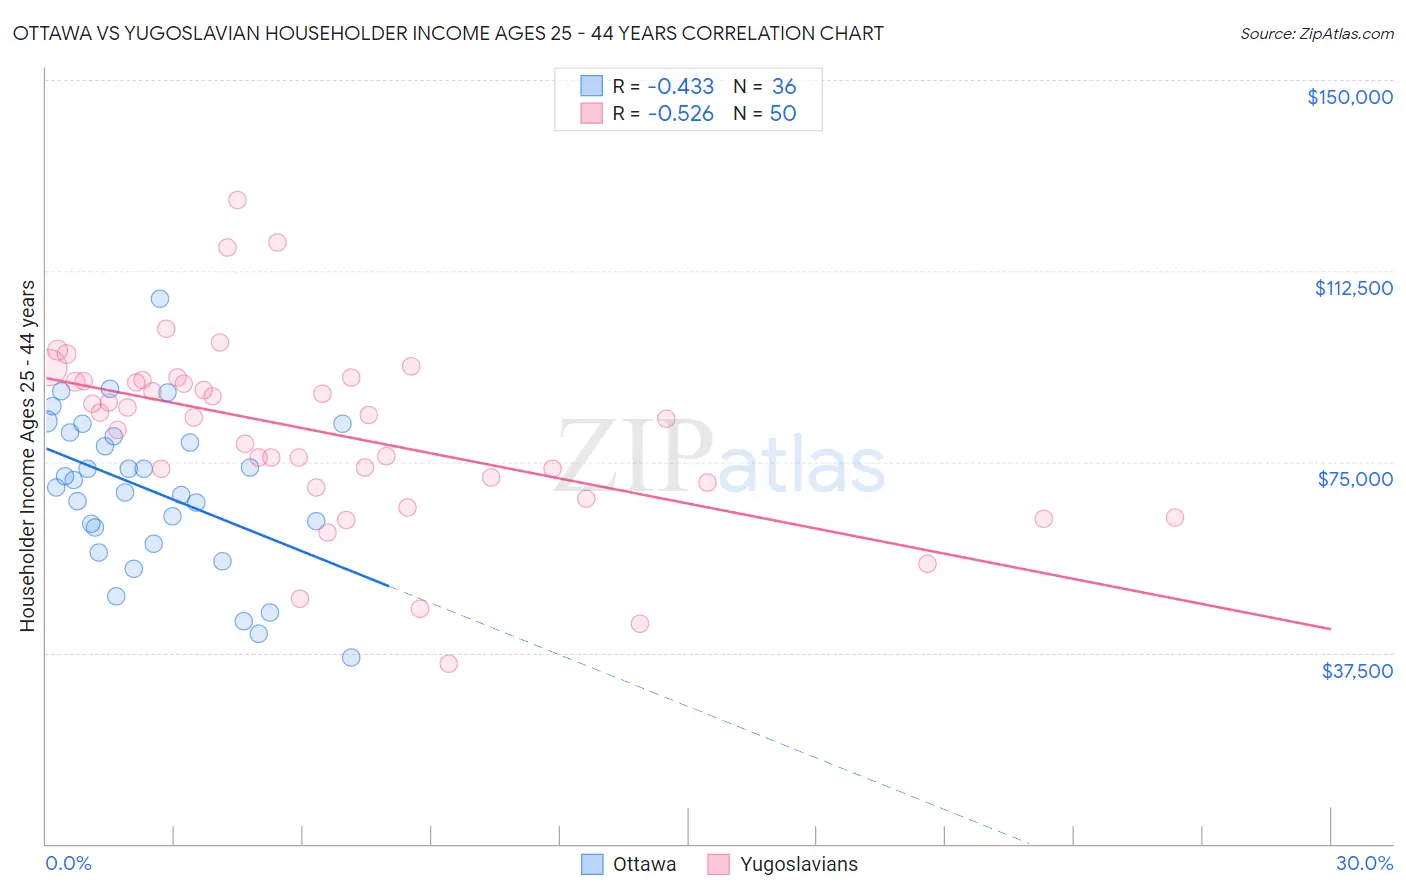
Ottawa vs Yugoslavian Householder Income Ages 25 - 44 years Correlation Chart
The statistical analysis conducted on geographies consisting of 49,887,469 people shows a moderate negative correlation between the proportion of Ottawa and household income with householder between the ages 25 and 44 in the United States with a correlation coefficient (R) of -0.433 and weighted average of $79,012. Similarly, the statistical analysis conducted on geographies consisting of 285,145,495 people shows a substantial negative correlation between the proportion of Yugoslavians and household income with householder between the ages 25 and 44 in the United States with a correlation coefficient (R) of -0.526 and weighted average of $91,368, a difference of 15.6%.
Householder Income Ages 25 - 44 years Correlation Summary
| Measurement | Ottawa | Yugoslavian |
| Minimum | $36,563 | $35,313 |
| Maximum | $106,935 | $126,461 |
| Range | $70,372 | $91,148 |
| Mean | $69,424 | $80,797 |
| Median | $70,740 | $83,915 |
| Interquartile 25% (IQ1) | $60,457 | $71,042 |
| Interquartile 75% (IQ3) | $80,364 | $90,884 |
| Interquartile Range (IQR) | $19,907 | $19,842 |
| Standard Deviation (Sample) | $15,349 | $18,085 |
| Standard Deviation (Population) | $15,134 | $17,903 |
Similar Demographics by Householder Income Ages 25 - 44 years
Demographics Similar to Ottawa by Householder Income Ages 25 - 44 years
In terms of householder income ages 25 - 44 years, the demographic groups most similar to Ottawa are African ($78,986, a difference of 0.030%), U.S. Virgin Islander ($78,911, a difference of 0.13%), Cheyenne ($79,152, a difference of 0.18%), Immigrants from Mexico ($78,809, a difference of 0.26%), and Menominee ($79,358, a difference of 0.44%).
| Demographics | Rating | Rank | Householder Income Ages 25 - 44 years |
| Immigrants | Central America | 0.0 /100 | #308 | Tragic $80,012 |
| Chippewa | 0.0 /100 | #309 | Tragic $80,005 |
| Fijians | 0.0 /100 | #310 | Tragic $79,956 |
| Indonesians | 0.0 /100 | #311 | Tragic $79,543 |
| Immigrants | Haiti | 0.0 /100 | #312 | Tragic $79,391 |
| Menominee | 0.0 /100 | #313 | Tragic $79,358 |
| Cheyenne | 0.0 /100 | #314 | Tragic $79,152 |
| Ottawa | 0.0 /100 | #315 | Tragic $79,012 |
| Africans | 0.0 /100 | #316 | Tragic $78,986 |
| U.S. Virgin Islanders | 0.0 /100 | #317 | Tragic $78,911 |
| Immigrants | Mexico | 0.0 /100 | #318 | Tragic $78,809 |
| Hondurans | 0.0 /100 | #319 | Tragic $78,540 |
| Choctaw | 0.0 /100 | #320 | Tragic $78,168 |
| Immigrants | Zaire | 0.0 /100 | #321 | Tragic $78,045 |
| Chickasaw | 0.0 /100 | #322 | Tragic $77,929 |
Demographics Similar to Yugoslavians by Householder Income Ages 25 - 44 years
In terms of householder income ages 25 - 44 years, the demographic groups most similar to Yugoslavians are Aleut ($91,370, a difference of 0.0%), Immigrants from Thailand ($91,337, a difference of 0.030%), Immigrants from Eastern Africa ($91,458, a difference of 0.10%), Nepalese ($91,498, a difference of 0.14%), and Immigrants from Cambodia ($91,533, a difference of 0.18%).
| Demographics | Rating | Rank | Householder Income Ages 25 - 44 years |
| Whites/Caucasians | 16.7 /100 | #200 | Poor $91,668 |
| Japanese | 16.4 /100 | #201 | Poor $91,624 |
| Ecuadorians | 16.0 /100 | #202 | Poor $91,574 |
| Immigrants | Cambodia | 15.7 /100 | #203 | Poor $91,533 |
| Nepalese | 15.4 /100 | #204 | Poor $91,498 |
| Immigrants | Eastern Africa | 15.2 /100 | #205 | Poor $91,458 |
| Aleuts | 14.5 /100 | #206 | Poor $91,370 |
| Yugoslavians | 14.5 /100 | #207 | Poor $91,368 |
| Immigrants | Thailand | 14.3 /100 | #208 | Poor $91,337 |
| Immigrants | Uruguay | 13.2 /100 | #209 | Poor $91,171 |
| Immigrants | Kenya | 10.9 /100 | #210 | Poor $90,767 |
| Iraqis | 10.8 /100 | #211 | Poor $90,764 |
| Hawaiians | 10.6 /100 | #212 | Poor $90,722 |
| Immigrants | Bangladesh | 9.3 /100 | #213 | Tragic $90,448 |
| Immigrants | Africa | 8.9 /100 | #214 | Tragic $90,372 |