Immigrants from Saudi Arabia vs Yugoslavian 8th Grade
COMPARE
Immigrants from Saudi Arabia
Yugoslavian
8th Grade
8th Grade Comparison
Immigrants from Saudi Arabia
Yugoslavians
96.3%
8TH GRADE
98.0/ 100
METRIC RATING
103rd/ 347
METRIC RANK
96.5%
8TH GRADE
99.4/ 100
METRIC RATING
78th/ 347
METRIC RANK
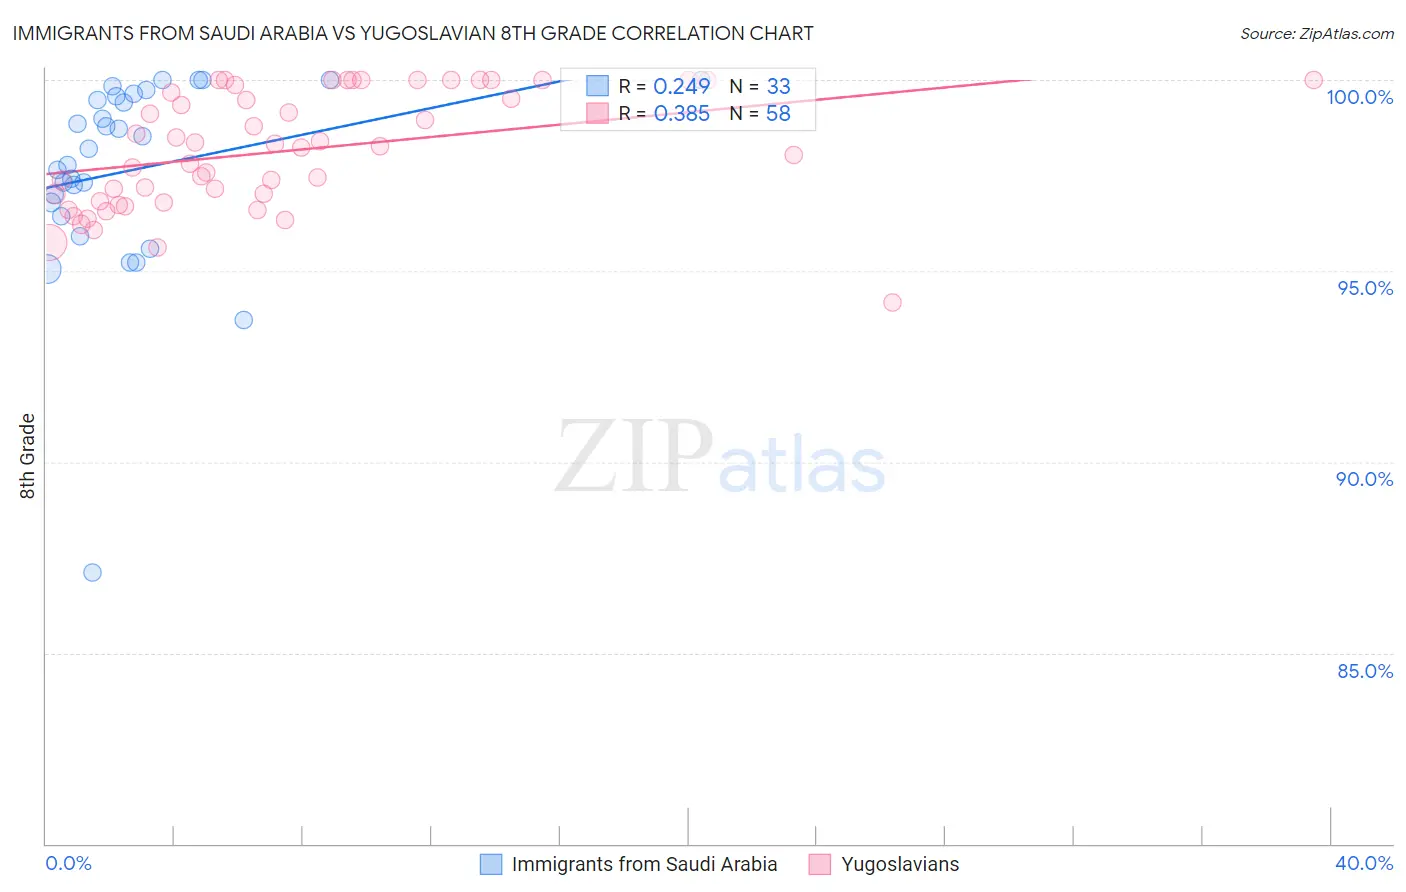
Immigrants from Saudi Arabia vs Yugoslavian 8th Grade Correlation Chart
The statistical analysis conducted on geographies consisting of 164,277,573 people shows a weak positive correlation between the proportion of Immigrants from Saudi Arabia and percentage of population with at least 8th grade education in the United States with a correlation coefficient (R) of 0.249 and weighted average of 96.3%. Similarly, the statistical analysis conducted on geographies consisting of 285,618,157 people shows a mild positive correlation between the proportion of Yugoslavians and percentage of population with at least 8th grade education in the United States with a correlation coefficient (R) of 0.385 and weighted average of 96.5%, a difference of 0.19%.
8th Grade Correlation Summary
| Measurement | Immigrants from Saudi Arabia | Yugoslavian |
| Minimum | 87.1% | 94.2% |
| Maximum | 100.0% | 100.0% |
| Range | 12.9% | 5.8% |
| Mean | 97.7% | 98.2% |
| Median | 98.2% | 98.2% |
| Interquartile 25% (IQ1) | 96.6% | 96.8% |
| Interquartile 75% (IQ3) | 99.6% | 99.9% |
| Interquartile Range (IQR) | 3.0% | 3.1% |
| Standard Deviation (Sample) | 2.6% | 1.5% |
| Standard Deviation (Population) | 2.5% | 1.5% |
Similar Demographics by 8th Grade
Demographics Similar to Immigrants from Saudi Arabia by 8th Grade
In terms of 8th grade, the demographic groups most similar to Immigrants from Saudi Arabia are Kiowa (96.3%, a difference of 0.0%), Immigrants from North Macedonia (96.3%, a difference of 0.0%), Okinawan (96.3%, a difference of 0.0%), South African (96.4%, a difference of 0.010%), and Immigrants from Latvia (96.3%, a difference of 0.010%).
| Demographics | Rating | Rank | 8th Grade |
| Potawatomi | 98.7 /100 | #96 | Exceptional 96.4% |
| Osage | 98.7 /100 | #97 | Exceptional 96.4% |
| Immigrants | Germany | 98.7 /100 | #98 | Exceptional 96.4% |
| Cree | 98.6 /100 | #99 | Exceptional 96.4% |
| Immigrants | Czechoslovakia | 98.6 /100 | #100 | Exceptional 96.4% |
| Bhutanese | 98.2 /100 | #101 | Exceptional 96.4% |
| South Africans | 98.2 /100 | #102 | Exceptional 96.4% |
| Immigrants | Saudi Arabia | 98.0 /100 | #103 | Exceptional 96.3% |
| Kiowa | 98.0 /100 | #104 | Exceptional 96.3% |
| Immigrants | North Macedonia | 98.0 /100 | #105 | Exceptional 96.3% |
| Okinawans | 98.0 /100 | #106 | Exceptional 96.3% |
| Immigrants | Latvia | 97.8 /100 | #107 | Exceptional 96.3% |
| Lebanese | 97.5 /100 | #108 | Exceptional 96.3% |
| Iroquois | 97.5 /100 | #109 | Exceptional 96.3% |
| Cajuns | 97.1 /100 | #110 | Exceptional 96.3% |
Demographics Similar to Yugoslavians by 8th Grade
In terms of 8th grade, the demographic groups most similar to Yugoslavians are Cypriot (96.5%, a difference of 0.0%), Zimbabwean (96.5%, a difference of 0.010%), Immigrants from Netherlands (96.5%, a difference of 0.010%), Immigrants from Ireland (96.5%, a difference of 0.020%), and Puget Sound Salish (96.5%, a difference of 0.020%).
| Demographics | Rating | Rank | 8th Grade |
| New Zealanders | 99.5 /100 | #71 | Exceptional 96.6% |
| Immigrants | England | 99.5 /100 | #72 | Exceptional 96.6% |
| Arapaho | 99.5 /100 | #73 | Exceptional 96.6% |
| Immigrants | Ireland | 99.5 /100 | #74 | Exceptional 96.5% |
| Zimbabweans | 99.4 /100 | #75 | Exceptional 96.5% |
| Immigrants | Netherlands | 99.4 /100 | #76 | Exceptional 96.5% |
| Cypriots | 99.4 /100 | #77 | Exceptional 96.5% |
| Yugoslavians | 99.4 /100 | #78 | Exceptional 96.5% |
| Puget Sound Salish | 99.3 /100 | #79 | Exceptional 96.5% |
| Delaware | 99.2 /100 | #80 | Exceptional 96.5% |
| Romanians | 99.2 /100 | #81 | Exceptional 96.5% |
| Turks | 99.2 /100 | #82 | Exceptional 96.5% |
| Icelanders | 99.2 /100 | #83 | Exceptional 96.5% |
| Immigrants | Belgium | 99.1 /100 | #84 | Exceptional 96.5% |
| Immigrants | South Africa | 99.1 /100 | #85 | Exceptional 96.5% |