Immigrants from Saudi Arabia vs Immigrants from Kenya Householder Income Under 25 years
COMPARE
Immigrants from Saudi Arabia
Immigrants from Kenya
Householder Income Under 25 years
Householder Income Under 25 years Comparison
Immigrants from Saudi Arabia
Immigrants from Kenya
$46,187
HOUSEHOLDER INCOME UNDER 25 YEARS
0.0/ 100
METRIC RATING
323rd/ 347
METRIC RANK
$49,633
HOUSEHOLDER INCOME UNDER 25 YEARS
0.2/ 100
METRIC RATING
275th/ 347
METRIC RANK
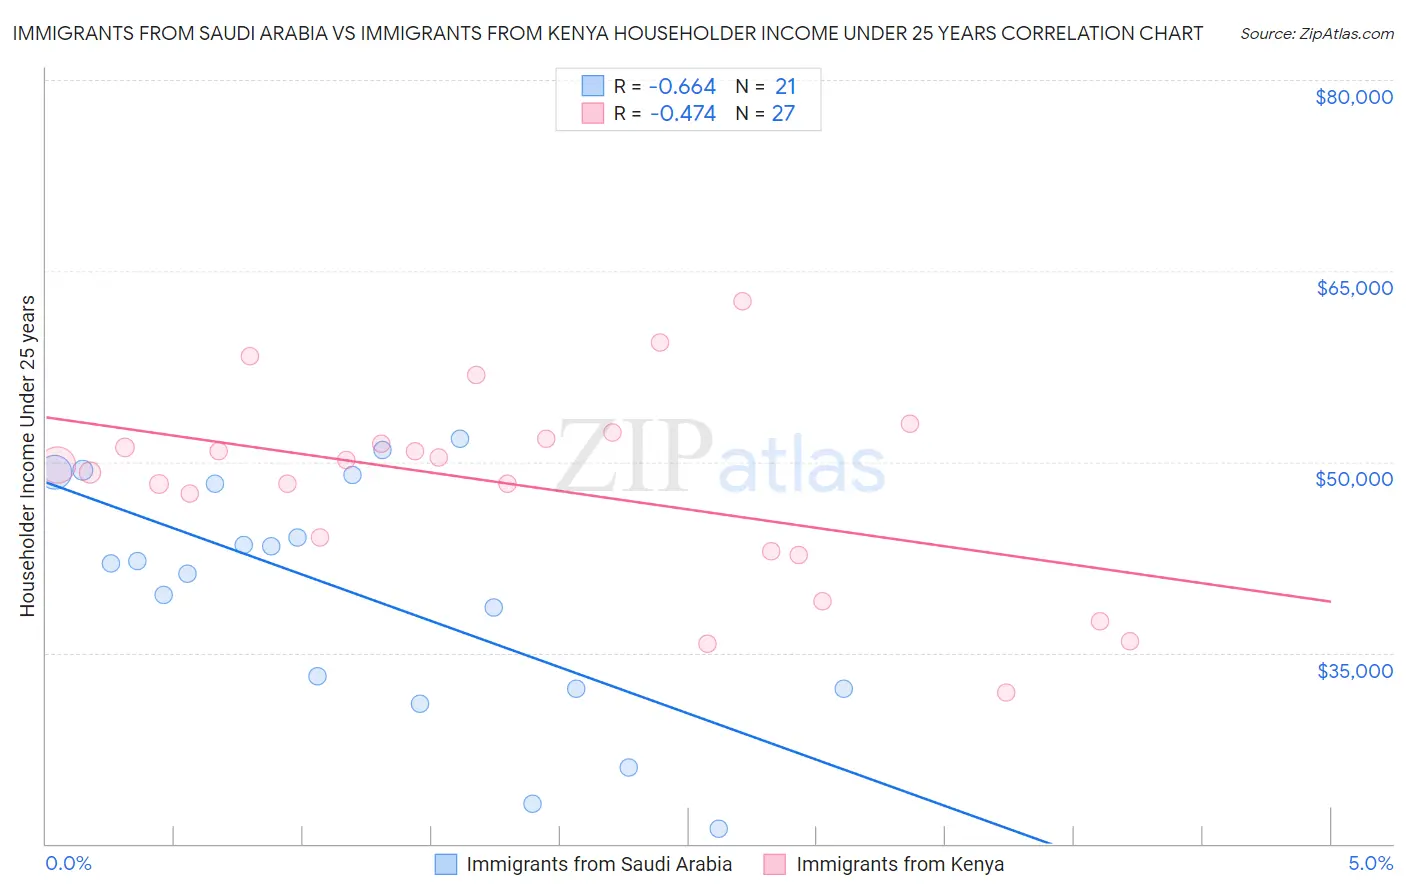
Immigrants from Saudi Arabia vs Immigrants from Kenya Householder Income Under 25 years Correlation Chart
The statistical analysis conducted on geographies consisting of 152,509,981 people shows a significant negative correlation between the proportion of Immigrants from Saudi Arabia and household income with householder under the age of 25 in the United States with a correlation coefficient (R) of -0.664 and weighted average of $46,187. Similarly, the statistical analysis conducted on geographies consisting of 195,493,950 people shows a moderate negative correlation between the proportion of Immigrants from Kenya and household income with householder under the age of 25 in the United States with a correlation coefficient (R) of -0.474 and weighted average of $49,633, a difference of 7.5%.
Householder Income Under 25 years Correlation Summary
| Measurement | Immigrants from Saudi Arabia | Immigrants from Kenya |
| Minimum | $21,200 | $31,849 |
| Maximum | $51,786 | $62,614 |
| Range | $30,586 | $30,765 |
| Mean | $39,611 | $48,142 |
| Median | $42,009 | $49,714 |
| Interquartile 25% (IQ1) | $32,174 | $42,964 |
| Interquartile 75% (IQ3) | $48,671 | $51,830 |
| Interquartile Range (IQR) | $16,497 | $8,867 |
| Standard Deviation (Sample) | $9,248 | $7,472 |
| Standard Deviation (Population) | $9,026 | $7,333 |
Similar Demographics by Householder Income Under 25 years
Demographics Similar to Immigrants from Saudi Arabia by Householder Income Under 25 years
In terms of householder income under 25 years, the demographic groups most similar to Immigrants from Saudi Arabia are Sioux ($46,417, a difference of 0.50%), Potawatomi ($46,462, a difference of 0.60%), Dutch West Indian ($45,816, a difference of 0.81%), Immigrants from Bahamas ($45,793, a difference of 0.86%), and Osage ($45,764, a difference of 0.92%).
| Demographics | Rating | Rank | Householder Income Under 25 years |
| Sudanese | 0.0 /100 | #316 | Tragic $46,982 |
| Hopi | 0.0 /100 | #317 | Tragic $46,978 |
| Spanish Americans | 0.0 /100 | #318 | Tragic $46,913 |
| Africans | 0.0 /100 | #319 | Tragic $46,838 |
| Immigrants | Sudan | 0.0 /100 | #320 | Tragic $46,791 |
| Potawatomi | 0.0 /100 | #321 | Tragic $46,462 |
| Sioux | 0.0 /100 | #322 | Tragic $46,417 |
| Immigrants | Saudi Arabia | 0.0 /100 | #323 | Tragic $46,187 |
| Dutch West Indians | 0.0 /100 | #324 | Tragic $45,816 |
| Immigrants | Bahamas | 0.0 /100 | #325 | Tragic $45,793 |
| Osage | 0.0 /100 | #326 | Tragic $45,764 |
| Bahamians | 0.0 /100 | #327 | Tragic $45,743 |
| German Russians | 0.0 /100 | #328 | Tragic $45,673 |
| Seminole | 0.0 /100 | #329 | Tragic $45,649 |
| Indonesians | 0.0 /100 | #330 | Tragic $45,566 |
Demographics Similar to Immigrants from Kenya by Householder Income Under 25 years
In terms of householder income under 25 years, the demographic groups most similar to Immigrants from Kenya are Dominican ($49,633, a difference of 0.0%), Immigrants from Western Africa ($49,621, a difference of 0.030%), Immigrants from Senegal ($49,742, a difference of 0.22%), Slovak ($49,753, a difference of 0.24%), and Colville ($49,774, a difference of 0.28%).
| Demographics | Rating | Rank | Householder Income Under 25 years |
| Venezuelans | 0.5 /100 | #268 | Tragic $50,011 |
| Ute | 0.5 /100 | #269 | Tragic $49,997 |
| Mexicans | 0.5 /100 | #270 | Tragic $49,989 |
| Taiwanese | 0.3 /100 | #271 | Tragic $49,804 |
| Colville | 0.3 /100 | #272 | Tragic $49,774 |
| Slovaks | 0.3 /100 | #273 | Tragic $49,753 |
| Immigrants | Senegal | 0.3 /100 | #274 | Tragic $49,742 |
| Immigrants | Kenya | 0.2 /100 | #275 | Tragic $49,633 |
| Dominicans | 0.2 /100 | #276 | Tragic $49,633 |
| Immigrants | Western Africa | 0.2 /100 | #277 | Tragic $49,621 |
| Nigerians | 0.1 /100 | #278 | Tragic $49,416 |
| Apache | 0.1 /100 | #279 | Tragic $49,395 |
| Hmong | 0.1 /100 | #280 | Tragic $49,364 |
| Immigrants | Nonimmigrants | 0.1 /100 | #281 | Tragic $49,348 |
| Alsatians | 0.1 /100 | #282 | Tragic $49,267 |