Immigrants from Saudi Arabia vs South American No Vehicles in Household
COMPARE
Immigrants from Saudi Arabia
South American
No Vehicles in Household
No Vehicles in Household Comparison
Immigrants from Saudi Arabia
South Americans
10.3%
NO VEHICLES IN HOUSEHOLD
58.8/ 100
METRIC RATING
167th/ 347
METRIC RANK
10.5%
NO VEHICLES IN HOUSEHOLD
41.9/ 100
METRIC RATING
185th/ 347
METRIC RANK
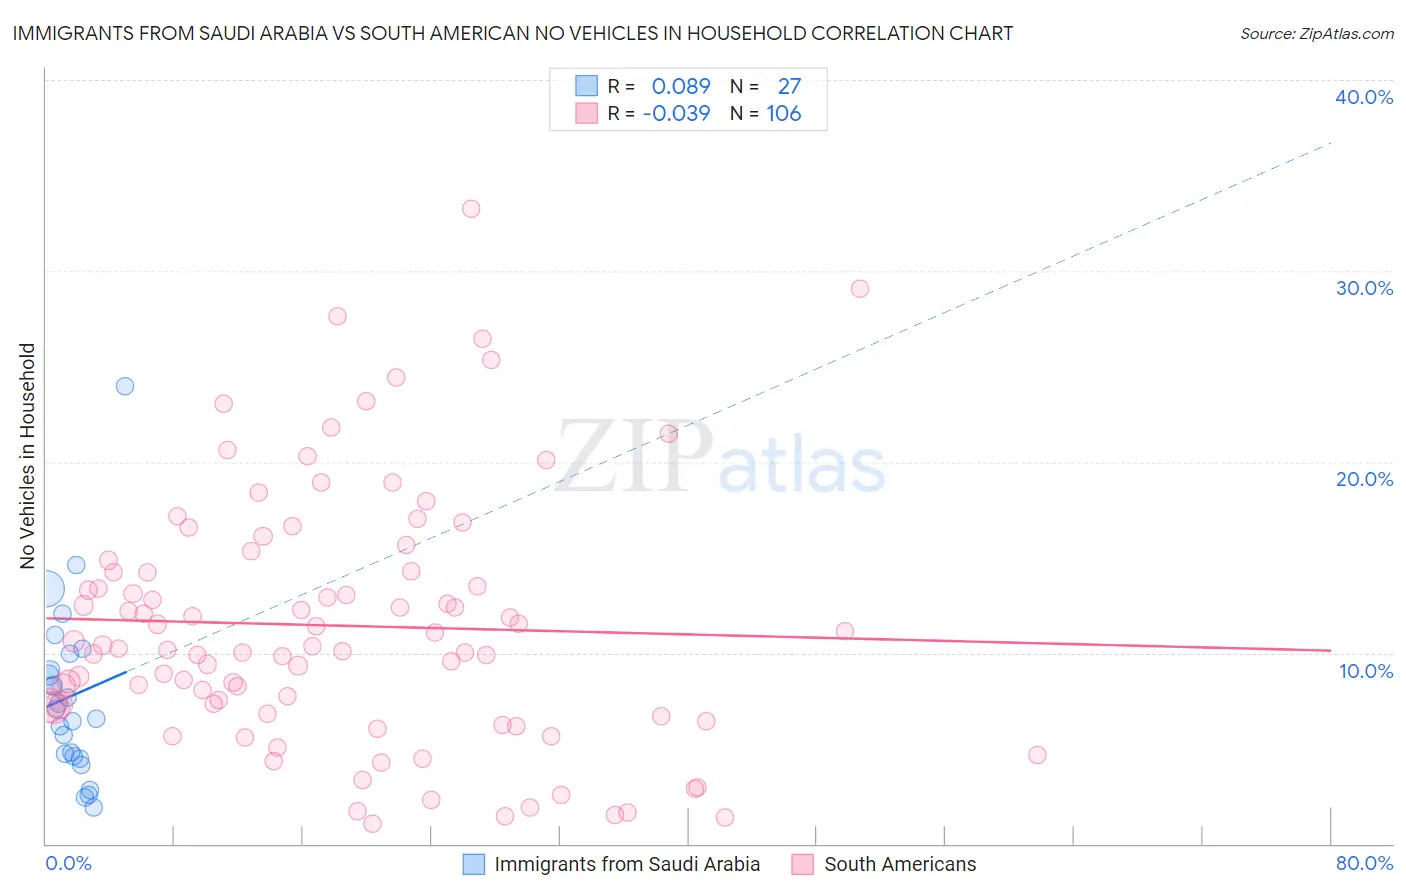
Immigrants from Saudi Arabia vs South American No Vehicles in Household Correlation Chart
The statistical analysis conducted on geographies consisting of 164,171,346 people shows a slight positive correlation between the proportion of Immigrants from Saudi Arabia and percentage of households with no vehicle available in the United States with a correlation coefficient (R) of 0.089 and weighted average of 10.3%. Similarly, the statistical analysis conducted on geographies consisting of 480,536,487 people shows no correlation between the proportion of South Americans and percentage of households with no vehicle available in the United States with a correlation coefficient (R) of -0.039 and weighted average of 10.5%, a difference of 2.3%.
No Vehicles in Household Correlation Summary
| Measurement | Immigrants from Saudi Arabia | South American |
| Minimum | 1.9% | 1.0% |
| Maximum | 24.0% | 33.2% |
| Range | 22.0% | 32.2% |
| Mean | 7.7% | 11.4% |
| Median | 7.1% | 10.3% |
| Interquartile 25% (IQ1) | 4.6% | 7.1% |
| Interquartile 75% (IQ3) | 10.0% | 14.2% |
| Interquartile Range (IQR) | 5.4% | 7.1% |
| Standard Deviation (Sample) | 4.6% | 6.6% |
| Standard Deviation (Population) | 4.6% | 6.6% |
Demographics Similar to Immigrants from Saudi Arabia and South Americans by No Vehicles in Household
In terms of no vehicles in household, the demographic groups most similar to Immigrants from Saudi Arabia are Immigrants from Costa Rica (10.3%, a difference of 0.24%), Indonesian (10.3%, a difference of 0.29%), Lumbee (10.3%, a difference of 0.56%), Immigrants from Latin America (10.4%, a difference of 0.78%), and Hmong (10.4%, a difference of 0.84%). Similarly, the demographic groups most similar to South Americans are Immigrants from Nepal (10.5%, a difference of 0.070%), German Russian (10.5%, a difference of 0.18%), Native/Alaskan (10.5%, a difference of 0.24%), Immigrants from Bulgaria (10.5%, a difference of 0.26%), and Immigrants from Colombia (10.5%, a difference of 0.30%).
| Demographics | Rating | Rank | No Vehicles in Household |
| Immigrants | Costa Rica | 60.5 /100 | #166 | Good 10.3% |
| Immigrants | Saudi Arabia | 58.8 /100 | #167 | Average 10.3% |
| Indonesians | 56.7 /100 | #168 | Average 10.3% |
| Lumbee | 54.7 /100 | #169 | Average 10.3% |
| Immigrants | Latin America | 53.2 /100 | #170 | Average 10.4% |
| Hmong | 52.7 /100 | #171 | Average 10.4% |
| Brazilians | 51.7 /100 | #172 | Average 10.4% |
| Filipinos | 50.1 /100 | #173 | Average 10.4% |
| Immigrants | Sudan | 50.0 /100 | #174 | Average 10.4% |
| Immigrants | Burma/Myanmar | 49.1 /100 | #175 | Average 10.4% |
| French American Indians | 49.1 /100 | #176 | Average 10.4% |
| Immigrants | El Salvador | 49.1 /100 | #177 | Average 10.4% |
| Immigrants | Ethiopia | 48.0 /100 | #178 | Average 10.4% |
| Ethiopians | 45.8 /100 | #179 | Average 10.5% |
| Arabs | 45.3 /100 | #180 | Average 10.5% |
| Immigrants | Colombia | 44.1 /100 | #181 | Average 10.5% |
| Immigrants | Bulgaria | 43.8 /100 | #182 | Average 10.5% |
| Natives/Alaskans | 43.7 /100 | #183 | Average 10.5% |
| Immigrants | Nepal | 42.4 /100 | #184 | Average 10.5% |
| South Americans | 41.9 /100 | #185 | Average 10.5% |
| German Russians | 40.6 /100 | #186 | Average 10.5% |