Immigrants from Saudi Arabia vs Immigrants from Brazil Householder Income Over 65 years
COMPARE
Immigrants from Saudi Arabia
Immigrants from Brazil
Householder Income Over 65 years
Householder Income Over 65 years Comparison
Immigrants from Saudi Arabia
Immigrants from Brazil
$63,355
HOUSEHOLDER INCOME OVER 65 YEARS
92.4/ 100
METRIC RATING
114th/ 347
METRIC RANK
$62,364
HOUSEHOLDER INCOME OVER 65 YEARS
81.2/ 100
METRIC RATING
134th/ 347
METRIC RANK
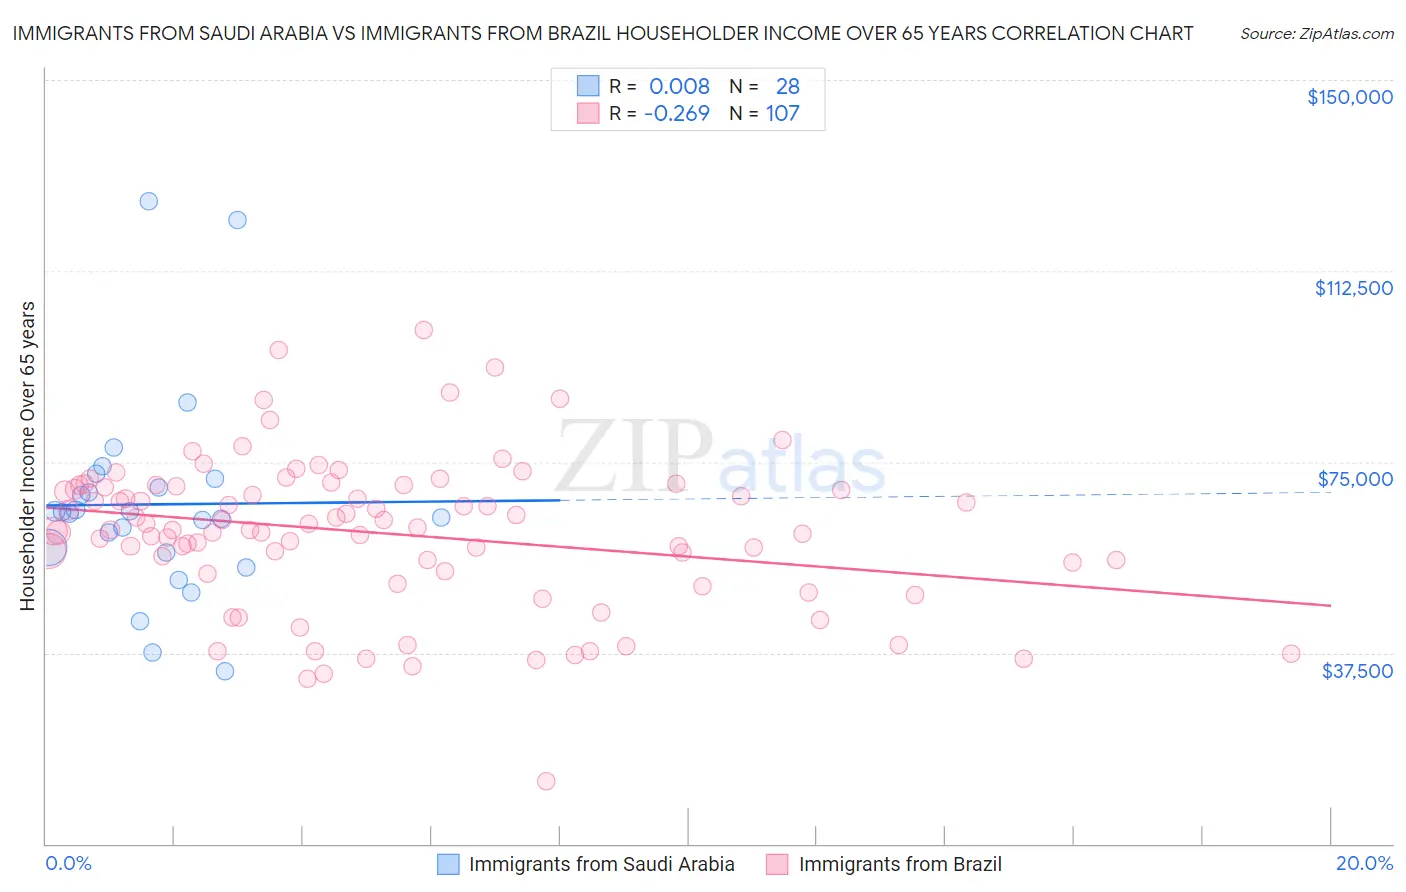
Immigrants from Saudi Arabia vs Immigrants from Brazil Householder Income Over 65 years Correlation Chart
The statistical analysis conducted on geographies consisting of 164,084,290 people shows no correlation between the proportion of Immigrants from Saudi Arabia and household income with householder over the age of 65 in the United States with a correlation coefficient (R) of 0.008 and weighted average of $63,355. Similarly, the statistical analysis conducted on geographies consisting of 342,081,092 people shows a weak negative correlation between the proportion of Immigrants from Brazil and household income with householder over the age of 65 in the United States with a correlation coefficient (R) of -0.269 and weighted average of $62,364, a difference of 1.6%.
Householder Income Over 65 years Correlation Summary
| Measurement | Immigrants from Saudi Arabia | Immigrants from Brazil |
| Minimum | $33,914 | $12,293 |
| Maximum | $126,236 | $100,809 |
| Range | $92,322 | $88,516 |
| Mean | $66,648 | $60,924 |
| Median | $65,018 | $61,677 |
| Interquartile 25% (IQ1) | $57,633 | $53,466 |
| Interquartile 75% (IQ3) | $70,874 | $70,121 |
| Interquartile Range (IQR) | $13,241 | $16,655 |
| Standard Deviation (Sample) | $19,913 | $14,904 |
| Standard Deviation (Population) | $19,554 | $14,834 |
Demographics Similar to Immigrants from Saudi Arabia and Immigrants from Brazil by Householder Income Over 65 years
In terms of householder income over 65 years, the demographic groups most similar to Immigrants from Saudi Arabia are Croatian ($63,225, a difference of 0.20%), Guamanian/Chamorro ($63,187, a difference of 0.26%), Immigrants from Croatia ($63,168, a difference of 0.30%), Danish ($63,117, a difference of 0.38%), and Immigrants from Jordan ($63,041, a difference of 0.50%). Similarly, the demographic groups most similar to Immigrants from Brazil are Immigrants from Northern Africa ($62,522, a difference of 0.25%), Immigrants from Germany ($62,544, a difference of 0.29%), Immigrants from Western Asia ($62,645, a difference of 0.45%), Basque ($62,653, a difference of 0.46%), and Immigrants from Eastern Europe ($62,693, a difference of 0.53%).
| Demographics | Rating | Rank | Householder Income Over 65 years |
| Immigrants | Saudi Arabia | 92.4 /100 | #114 | Exceptional $63,355 |
| Croatians | 91.4 /100 | #115 | Exceptional $63,225 |
| Guamanians/Chamorros | 91.1 /100 | #116 | Exceptional $63,187 |
| Immigrants | Croatia | 90.9 /100 | #117 | Exceptional $63,168 |
| Danes | 90.5 /100 | #118 | Exceptional $63,117 |
| Immigrants | Jordan | 89.8 /100 | #119 | Excellent $63,041 |
| Ukrainians | 89.7 /100 | #120 | Excellent $63,032 |
| Immigrants | Vietnam | 89.5 /100 | #121 | Excellent $63,014 |
| Immigrants | Moldova | 88.7 /100 | #122 | Excellent $62,939 |
| Tlingit-Haida | 88.6 /100 | #123 | Excellent $62,922 |
| Taiwanese | 88.3 /100 | #124 | Excellent $62,894 |
| Soviet Union | 87.8 /100 | #125 | Excellent $62,848 |
| Peruvians | 86.8 /100 | #126 | Excellent $62,766 |
| Swedes | 86.4 /100 | #127 | Excellent $62,736 |
| Aleuts | 86.1 /100 | #128 | Excellent $62,708 |
| Immigrants | Eastern Europe | 85.9 /100 | #129 | Excellent $62,693 |
| Basques | 85.4 /100 | #130 | Excellent $62,653 |
| Immigrants | Western Asia | 85.3 /100 | #131 | Excellent $62,645 |
| Immigrants | Germany | 83.9 /100 | #132 | Excellent $62,544 |
| Immigrants | Northern Africa | 83.6 /100 | #133 | Excellent $62,522 |
| Immigrants | Brazil | 81.2 /100 | #134 | Excellent $62,364 |