Immigrants from Romania vs Mexican American Indian 4th Grade
COMPARE
Immigrants from Romania
Mexican American Indian
4th Grade
4th Grade Comparison
Immigrants from Romania
Mexican American Indians
97.7%
4TH GRADE
90.6/ 100
METRIC RATING
130th/ 347
METRIC RANK
95.8%
4TH GRADE
0.0/ 100
METRIC RATING
328th/ 347
METRIC RANK
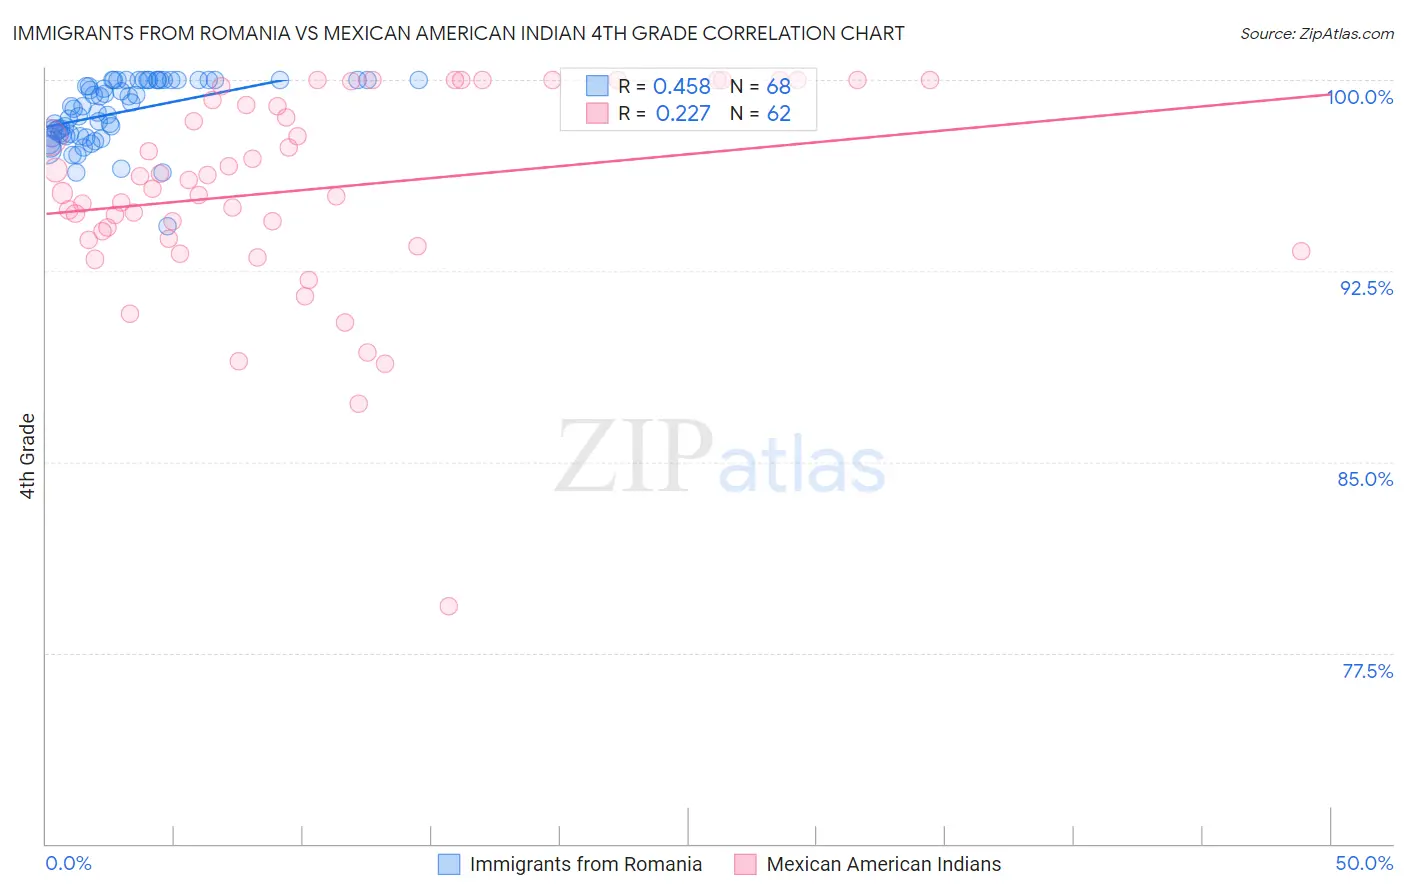
Immigrants from Romania vs Mexican American Indian 4th Grade Correlation Chart
The statistical analysis conducted on geographies consisting of 257,007,131 people shows a moderate positive correlation between the proportion of Immigrants from Romania and percentage of population with at least 4th grade education in the United States with a correlation coefficient (R) of 0.458 and weighted average of 97.7%. Similarly, the statistical analysis conducted on geographies consisting of 317,621,104 people shows a weak positive correlation between the proportion of Mexican American Indians and percentage of population with at least 4th grade education in the United States with a correlation coefficient (R) of 0.227 and weighted average of 95.8%, a difference of 2.0%.
4th Grade Correlation Summary
| Measurement | Immigrants from Romania | Mexican American Indian |
| Minimum | 94.3% | 79.3% |
| Maximum | 100.0% | 100.0% |
| Range | 5.7% | 20.7% |
| Mean | 98.7% | 95.7% |
| Median | 98.9% | 95.9% |
| Interquartile 25% (IQ1) | 97.8% | 93.8% |
| Interquartile 75% (IQ3) | 100.0% | 99.2% |
| Interquartile Range (IQR) | 2.2% | 5.5% |
| Standard Deviation (Sample) | 1.2% | 3.9% |
| Standard Deviation (Population) | 1.2% | 3.9% |
Similar Demographics by 4th Grade
Demographics Similar to Immigrants from Romania by 4th Grade
In terms of 4th grade, the demographic groups most similar to Immigrants from Romania are Immigrants from Bulgaria (97.7%, a difference of 0.010%), Immigrants from Kuwait (97.7%, a difference of 0.010%), Immigrants from Hungary (97.7%, a difference of 0.010%), Immigrants from Europe (97.8%, a difference of 0.020%), and Colville (97.7%, a difference of 0.020%).
| Demographics | Rating | Rank | 4th Grade |
| Immigrants | Zimbabwe | 93.9 /100 | #123 | Exceptional 97.8% |
| Spanish | 93.7 /100 | #124 | Exceptional 97.8% |
| Immigrants | Serbia | 92.6 /100 | #125 | Exceptional 97.8% |
| Immigrants | Europe | 92.5 /100 | #126 | Exceptional 97.8% |
| Colville | 92.3 /100 | #127 | Exceptional 97.7% |
| Pima | 92.0 /100 | #128 | Exceptional 97.7% |
| Immigrants | Bulgaria | 91.3 /100 | #129 | Exceptional 97.7% |
| Immigrants | Romania | 90.6 /100 | #130 | Exceptional 97.7% |
| Immigrants | Kuwait | 89.7 /100 | #131 | Excellent 97.7% |
| Immigrants | Hungary | 89.3 /100 | #132 | Excellent 97.7% |
| Hmong | 88.2 /100 | #133 | Excellent 97.7% |
| Palestinians | 88.1 /100 | #134 | Excellent 97.7% |
| Cambodians | 87.8 /100 | #135 | Excellent 97.7% |
| Israelis | 86.2 /100 | #136 | Excellent 97.7% |
| Immigrants | Turkey | 86.0 /100 | #137 | Excellent 97.7% |
Demographics Similar to Mexican American Indians by 4th Grade
In terms of 4th grade, the demographic groups most similar to Mexican American Indians are Immigrants from Cambodia (95.8%, a difference of 0.010%), Immigrants from Fiji (95.8%, a difference of 0.020%), Immigrants from Armenia (95.8%, a difference of 0.070%), Immigrants from Honduras (95.8%, a difference of 0.080%), and Honduran (96.0%, a difference of 0.11%).
| Demographics | Rating | Rank | 4th Grade |
| Japanese | 0.0 /100 | #321 | Tragic 96.0% |
| Immigrants | Vietnam | 0.0 /100 | #322 | Tragic 96.0% |
| Immigrants | Nicaragua | 0.0 /100 | #323 | Tragic 96.0% |
| Immigrants | Belize | 0.0 /100 | #324 | Tragic 96.0% |
| Dominicans | 0.0 /100 | #325 | Tragic 96.0% |
| Hispanics or Latinos | 0.0 /100 | #326 | Tragic 96.0% |
| Hondurans | 0.0 /100 | #327 | Tragic 96.0% |
| Mexican American Indians | 0.0 /100 | #328 | Tragic 95.8% |
| Immigrants | Cambodia | 0.0 /100 | #329 | Tragic 95.8% |
| Immigrants | Fiji | 0.0 /100 | #330 | Tragic 95.8% |
| Immigrants | Armenia | 0.0 /100 | #331 | Tragic 95.8% |
| Immigrants | Honduras | 0.0 /100 | #332 | Tragic 95.8% |
| Immigrants | Dominican Republic | 0.0 /100 | #333 | Tragic 95.7% |
| Immigrants | Cabo Verde | 0.0 /100 | #334 | Tragic 95.7% |
| Immigrants | Latin America | 0.0 /100 | #335 | Tragic 95.7% |