Immigrants from Romania vs Immigrants from Singapore Median Household Income
COMPARE
Immigrants from Romania
Immigrants from Singapore
Median Household Income
Median Household Income Comparison
Immigrants from Romania
Immigrants from Singapore
$94,222
MEDIAN HOUSEHOLD INCOME
99.7/ 100
METRIC RATING
66th/ 347
METRIC RANK
$110,428
MEDIAN HOUSEHOLD INCOME
100.0/ 100
METRIC RATING
6th/ 347
METRIC RANK
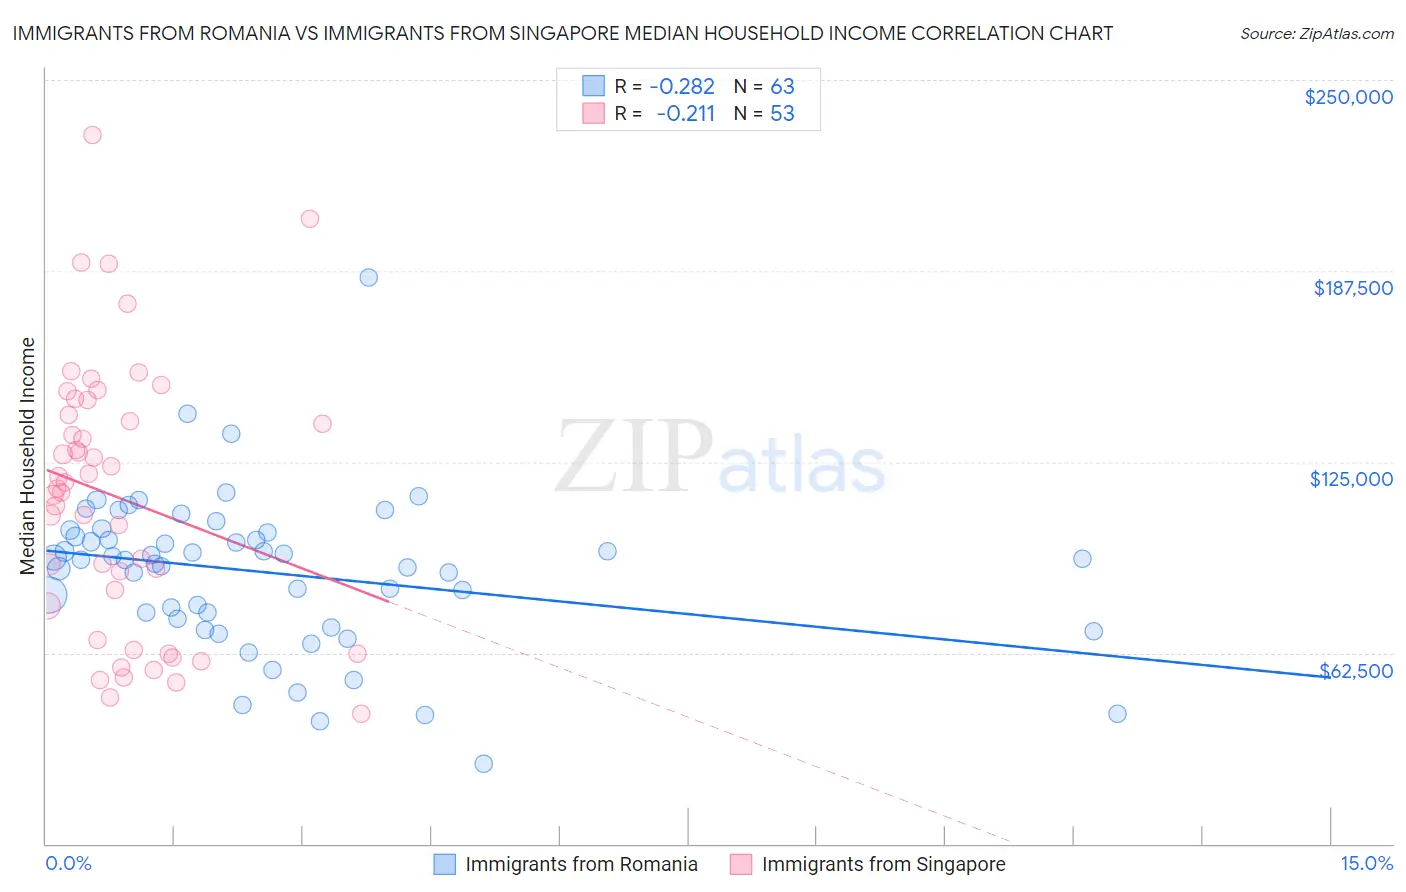
Immigrants from Romania vs Immigrants from Singapore Median Household Income Correlation Chart
The statistical analysis conducted on geographies consisting of 256,926,750 people shows a weak negative correlation between the proportion of Immigrants from Romania and median household income in the United States with a correlation coefficient (R) of -0.282 and weighted average of $94,222. Similarly, the statistical analysis conducted on geographies consisting of 137,415,639 people shows a weak negative correlation between the proportion of Immigrants from Singapore and median household income in the United States with a correlation coefficient (R) of -0.211 and weighted average of $110,428, a difference of 17.2%.
Median Household Income Correlation Summary
| Measurement | Immigrants from Romania | Immigrants from Singapore |
| Minimum | $26,354 | $42,500 |
| Maximum | $185,464 | $232,046 |
| Range | $159,110 | $189,546 |
| Mean | $88,756 | $113,253 |
| Median | $92,853 | $116,276 |
| Interquartile 25% (IQ1) | $73,566 | $72,208 |
| Interquartile 75% (IQ3) | $102,083 | $142,877 |
| Interquartile Range (IQR) | $28,517 | $70,669 |
| Standard Deviation (Sample) | $25,703 | $43,740 |
| Standard Deviation (Population) | $25,499 | $43,325 |
Similar Demographics by Median Household Income
Demographics Similar to Immigrants from Romania by Median Household Income
In terms of median household income, the demographic groups most similar to Immigrants from Romania are Immigrants from Scotland ($94,091, a difference of 0.14%), Immigrants from Belarus ($94,399, a difference of 0.19%), Immigrants from Netherlands ($94,411, a difference of 0.20%), Mongolian ($93,971, a difference of 0.27%), and Argentinean ($93,960, a difference of 0.28%).
| Demographics | Rating | Rank | Median Household Income |
| Immigrants | Europe | 99.8 /100 | #59 | Exceptional $95,032 |
| Koreans | 99.8 /100 | #60 | Exceptional $95,018 |
| Laotians | 99.8 /100 | #61 | Exceptional $94,990 |
| Immigrants | Norway | 99.8 /100 | #62 | Exceptional $94,846 |
| Greeks | 99.8 /100 | #63 | Exceptional $94,735 |
| Immigrants | Netherlands | 99.7 /100 | #64 | Exceptional $94,411 |
| Immigrants | Belarus | 99.7 /100 | #65 | Exceptional $94,399 |
| Immigrants | Romania | 99.7 /100 | #66 | Exceptional $94,222 |
| Immigrants | Scotland | 99.7 /100 | #67 | Exceptional $94,091 |
| Mongolians | 99.7 /100 | #68 | Exceptional $93,971 |
| Argentineans | 99.7 /100 | #69 | Exceptional $93,960 |
| Immigrants | Fiji | 99.7 /100 | #70 | Exceptional $93,933 |
| Immigrants | Philippines | 99.6 /100 | #71 | Exceptional $93,899 |
| Lithuanians | 99.6 /100 | #72 | Exceptional $93,852 |
| Immigrants | Egypt | 99.6 /100 | #73 | Exceptional $93,700 |
Demographics Similar to Immigrants from Singapore by Median Household Income
In terms of median household income, the demographic groups most similar to Immigrants from Singapore are Thai ($110,648, a difference of 0.20%), Iranian ($109,835, a difference of 0.54%), Immigrants from Hong Kong ($111,519, a difference of 0.99%), Immigrants from Iran ($108,055, a difference of 2.2%), and Immigrants from India ($113,009, a difference of 2.3%).
| Demographics | Rating | Rank | Median Household Income |
| Immigrants | Taiwan | 100.0 /100 | #1 | Exceptional $116,460 |
| Filipinos | 100.0 /100 | #2 | Exceptional $115,509 |
| Immigrants | India | 100.0 /100 | #3 | Exceptional $113,009 |
| Immigrants | Hong Kong | 100.0 /100 | #4 | Exceptional $111,519 |
| Thais | 100.0 /100 | #5 | Exceptional $110,648 |
| Immigrants | Singapore | 100.0 /100 | #6 | Exceptional $110,428 |
| Iranians | 100.0 /100 | #7 | Exceptional $109,835 |
| Immigrants | Iran | 100.0 /100 | #8 | Exceptional $108,055 |
| Okinawans | 100.0 /100 | #9 | Exceptional $106,624 |
| Immigrants | South Central Asia | 100.0 /100 | #10 | Exceptional $106,057 |
| Immigrants | China | 100.0 /100 | #11 | Exceptional $105,335 |
| Indians (Asian) | 100.0 /100 | #12 | Exceptional $105,262 |
| Immigrants | Eastern Asia | 100.0 /100 | #13 | Exceptional $104,796 |
| Immigrants | Ireland | 100.0 /100 | #14 | Exceptional $104,692 |
| Immigrants | Israel | 100.0 /100 | #15 | Exceptional $104,090 |