Immigrants from Portugal vs Immigrants from North Macedonia Median Earnings
COMPARE
Immigrants from Portugal
Immigrants from North Macedonia
Median Earnings
Median Earnings Comparison
Immigrants from Portugal
Immigrants from North Macedonia
$47,304
MEDIAN EARNINGS
77.3/ 100
METRIC RATING
154th/ 347
METRIC RANK
$49,658
MEDIAN EARNINGS
98.9/ 100
METRIC RATING
97th/ 347
METRIC RANK
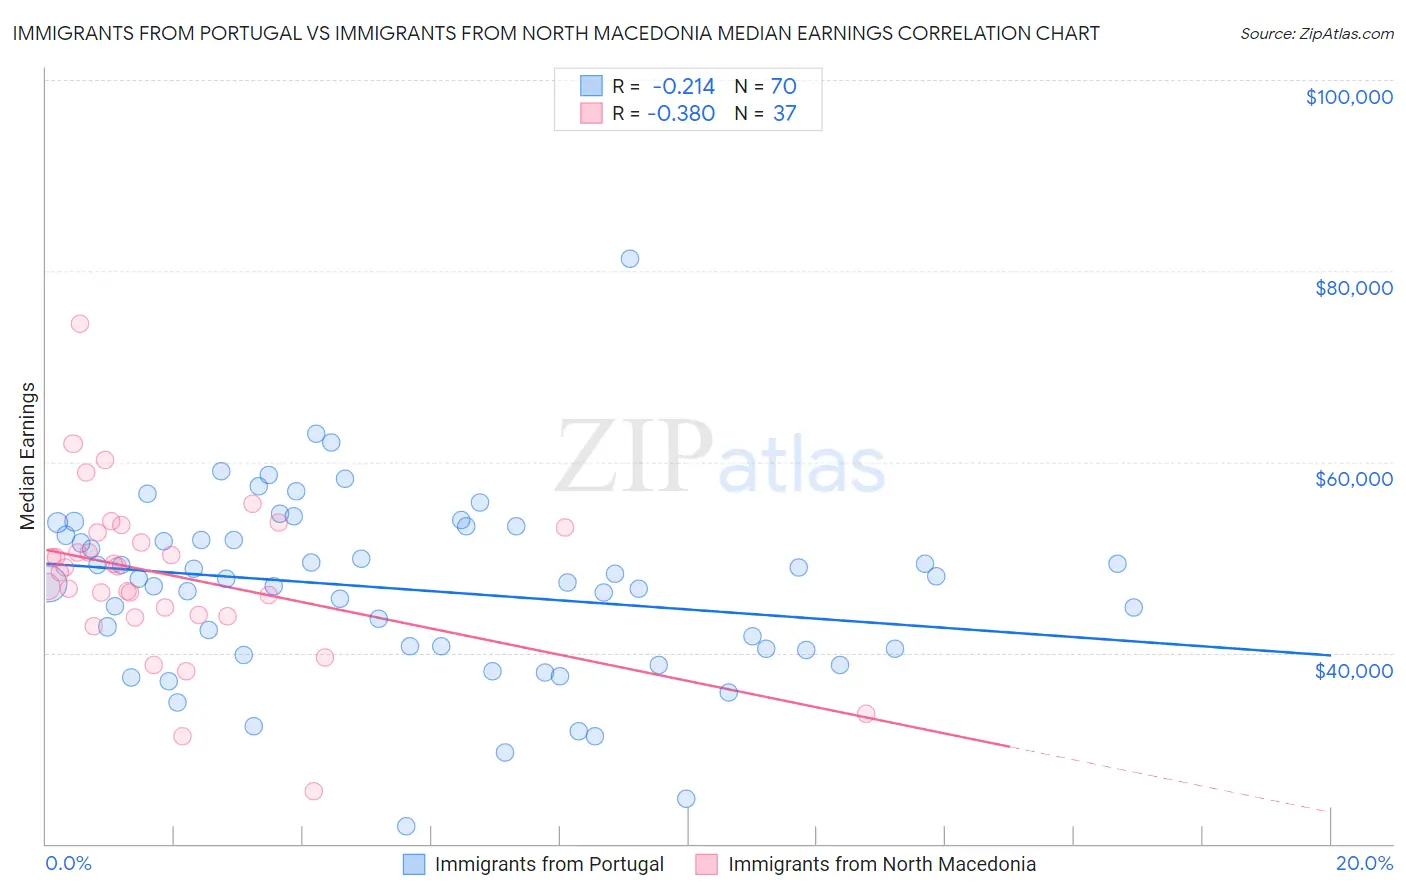
Immigrants from Portugal vs Immigrants from North Macedonia Median Earnings Correlation Chart
The statistical analysis conducted on geographies consisting of 174,787,782 people shows a weak negative correlation between the proportion of Immigrants from Portugal and median earnings in the United States with a correlation coefficient (R) of -0.214 and weighted average of $47,304. Similarly, the statistical analysis conducted on geographies consisting of 74,300,435 people shows a mild negative correlation between the proportion of Immigrants from North Macedonia and median earnings in the United States with a correlation coefficient (R) of -0.380 and weighted average of $49,658, a difference of 5.0%.
Median Earnings Correlation Summary
| Measurement | Immigrants from Portugal | Immigrants from North Macedonia |
| Minimum | $21,818 | $25,438 |
| Maximum | $81,250 | $74,419 |
| Range | $59,432 | $48,981 |
| Mean | $46,644 | $48,126 |
| Median | $47,553 | $48,906 |
| Interquartile 25% (IQ1) | $40,436 | $43,904 |
| Interquartile 75% (IQ3) | $52,307 | $52,892 |
| Interquartile Range (IQR) | $11,871 | $8,988 |
| Standard Deviation (Sample) | $9,540 | $8,757 |
| Standard Deviation (Population) | $9,471 | $8,638 |
Similar Demographics by Median Earnings
Demographics Similar to Immigrants from Portugal by Median Earnings
In terms of median earnings, the demographic groups most similar to Immigrants from Portugal are Immigrants from Vietnam ($47,282, a difference of 0.050%), Irish ($47,276, a difference of 0.060%), Czech ($47,221, a difference of 0.18%), Slavic ($47,470, a difference of 0.35%), and Slovak ($47,095, a difference of 0.44%).
| Demographics | Rating | Rank | Median Earnings |
| Immigrants | South Eastern Asia | 85.0 /100 | #147 | Excellent $47,671 |
| Immigrants | Eritrea | 84.8 /100 | #148 | Excellent $47,657 |
| Luxembourgers | 84.5 /100 | #149 | Excellent $47,640 |
| Peruvians | 84.2 /100 | #150 | Excellent $47,628 |
| Immigrants | Oceania | 84.1 /100 | #151 | Excellent $47,617 |
| Immigrants | Germany | 83.1 /100 | #152 | Excellent $47,566 |
| Slavs | 81.1 /100 | #153 | Excellent $47,470 |
| Immigrants | Portugal | 77.3 /100 | #154 | Good $47,304 |
| Immigrants | Vietnam | 76.7 /100 | #155 | Good $47,282 |
| Irish | 76.6 /100 | #156 | Good $47,276 |
| Czechs | 75.1 /100 | #157 | Good $47,221 |
| Slovaks | 71.7 /100 | #158 | Good $47,095 |
| Immigrants | Peru | 69.6 /100 | #159 | Good $47,025 |
| Alsatians | 69.6 /100 | #160 | Good $47,023 |
| Immigrants | Eastern Africa | 68.0 /100 | #161 | Good $46,969 |
Demographics Similar to Immigrants from North Macedonia by Median Earnings
In terms of median earnings, the demographic groups most similar to Immigrants from North Macedonia are Immigrants from Northern Africa ($49,648, a difference of 0.020%), Immigrants from Afghanistan ($49,645, a difference of 0.030%), Immigrants from Lebanon ($49,682, a difference of 0.050%), Immigrants from Poland ($49,633, a difference of 0.050%), and Jordanian ($49,632, a difference of 0.050%).
| Demographics | Rating | Rank | Median Earnings |
| Italians | 99.3 /100 | #90 | Exceptional $49,915 |
| Macedonians | 99.2 /100 | #91 | Exceptional $49,893 |
| Immigrants | Argentina | 99.2 /100 | #92 | Exceptional $49,841 |
| Armenians | 99.1 /100 | #93 | Exceptional $49,804 |
| Croatians | 99.0 /100 | #94 | Exceptional $49,724 |
| Immigrants | England | 99.0 /100 | #95 | Exceptional $49,722 |
| Immigrants | Lebanon | 99.0 /100 | #96 | Exceptional $49,682 |
| Immigrants | North Macedonia | 98.9 /100 | #97 | Exceptional $49,658 |
| Immigrants | Northern Africa | 98.9 /100 | #98 | Exceptional $49,648 |
| Immigrants | Afghanistan | 98.9 /100 | #99 | Exceptional $49,645 |
| Immigrants | Poland | 98.9 /100 | #100 | Exceptional $49,633 |
| Jordanians | 98.9 /100 | #101 | Exceptional $49,632 |
| Ethiopians | 98.8 /100 | #102 | Exceptional $49,572 |
| Austrians | 98.7 /100 | #103 | Exceptional $49,501 |
| Immigrants | Brazil | 98.6 /100 | #104 | Exceptional $49,463 |