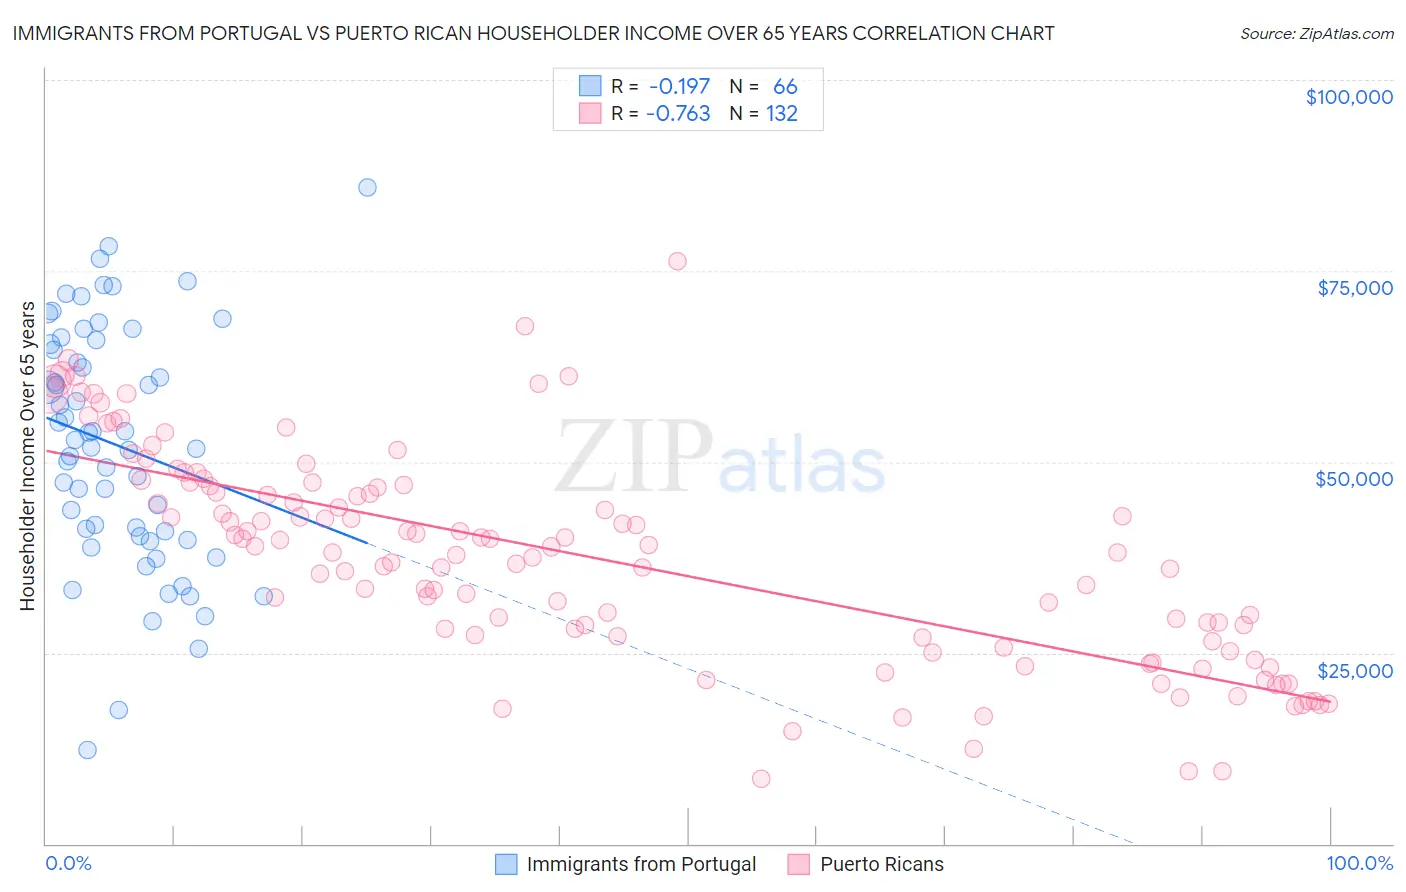
Immigrants from Portugal vs Puerto Rican Householder Income Over 65 years
COMPARE
Immigrants from Portugal
Puerto Rican
Householder Income Over 65 years
Householder Income Over 65 years Comparison
Immigrants from Portugal
Puerto Ricans
$55,924
HOUSEHOLDER INCOME OVER 65 YEARS
0.5/ 100
METRIC RATING
251st/ 347
METRIC RANK
$42,550
HOUSEHOLDER INCOME OVER 65 YEARS
0.0/ 100
METRIC RATING
346th/ 347
METRIC RANK
Immigrants from Portugal vs Puerto Rican Householder Income Over 65 years Correlation Chart
The statistical analysis conducted on geographies consisting of 174,564,681 people shows a poor negative correlation between the proportion of Immigrants from Portugal and household income with householder over the age of 65 in the United States with a correlation coefficient (R) of -0.197 and weighted average of $55,924. Similarly, the statistical analysis conducted on geographies consisting of 524,809,203 people shows a strong negative correlation between the proportion of Puerto Ricans and household income with householder over the age of 65 in the United States with a correlation coefficient (R) of -0.763 and weighted average of $42,550, a difference of 31.4%.
Householder Income Over 65 years Correlation Summary
| Measurement | Immigrants from Portugal | Puerto Rican |
| Minimum | $12,293 | $8,529 |
| Maximum | $85,927 | $76,277 |
| Range | $73,634 | $67,748 |
| Mean | $52,138 | $37,319 |
| Median | $52,364 | $38,145 |
| Interquartile 25% (IQ1) | $40,233 | $26,777 |
| Interquartile 75% (IQ3) | $65,422 | $46,716 |
| Interquartile Range (IQR) | $25,189 | $19,939 |
| Standard Deviation (Sample) | $15,656 | $13,872 |
| Standard Deviation (Population) | $15,537 | $13,820 |
Similar Demographics by Householder Income Over 65 years
Demographics Similar to Immigrants from Portugal by Householder Income Over 65 years
In terms of householder income over 65 years, the demographic groups most similar to Immigrants from Portugal are Immigrants from Bosnia and Herzegovina ($55,986, a difference of 0.11%), Mexican American Indian ($56,089, a difference of 0.30%), Vietnamese ($56,143, a difference of 0.39%), Osage ($55,677, a difference of 0.44%), and Yakama ($56,234, a difference of 0.55%).
| Demographics | Rating | Rank | Householder Income Over 65 years |
| Hmong | 0.8 /100 | #244 | Tragic $56,339 |
| Immigrants | Uzbekistan | 0.8 /100 | #245 | Tragic $56,331 |
| Central Americans | 0.8 /100 | #246 | Tragic $56,321 |
| Yakama | 0.7 /100 | #247 | Tragic $56,234 |
| Vietnamese | 0.6 /100 | #248 | Tragic $56,143 |
| Mexican American Indians | 0.6 /100 | #249 | Tragic $56,089 |
| Immigrants | Bosnia and Herzegovina | 0.5 /100 | #250 | Tragic $55,986 |
| Immigrants | Portugal | 0.5 /100 | #251 | Tragic $55,924 |
| Osage | 0.4 /100 | #252 | Tragic $55,677 |
| Immigrants | Trinidad and Tobago | 0.4 /100 | #253 | Tragic $55,598 |
| Americans | 0.3 /100 | #254 | Tragic $55,527 |
| Immigrants | Bangladesh | 0.3 /100 | #255 | Tragic $55,394 |
| German Russians | 0.3 /100 | #256 | Tragic $55,356 |
| Trinidadians and Tobagonians | 0.3 /100 | #257 | Tragic $55,327 |
| Ecuadorians | 0.2 /100 | #258 | Tragic $54,958 |
Demographics Similar to Puerto Ricans by Householder Income Over 65 years
In terms of householder income over 65 years, the demographic groups most similar to Puerto Ricans are Lumbee ($40,550, a difference of 4.9%), Immigrants from Cuba ($44,735, a difference of 5.1%), Houma ($44,822, a difference of 5.3%), Immigrants from Dominican Republic ($45,758, a difference of 7.5%), and Immigrants from Cabo Verde ($46,654, a difference of 9.7%).
| Demographics | Rating | Rank | Householder Income Over 65 years |
| Cape Verdeans | 0.0 /100 | #333 | Tragic $50,077 |
| Immigrants | Dominica | 0.0 /100 | #334 | Tragic $50,071 |
| Crow | 0.0 /100 | #335 | Tragic $49,234 |
| Cubans | 0.0 /100 | #336 | Tragic $49,152 |
| Tohono O'odham | 0.0 /100 | #337 | Tragic $49,121 |
| Immigrants | Caribbean | 0.0 /100 | #338 | Tragic $48,535 |
| Navajo | 0.0 /100 | #339 | Tragic $47,722 |
| Immigrants | Yemen | 0.0 /100 | #340 | Tragic $47,527 |
| Dominicans | 0.0 /100 | #341 | Tragic $46,964 |
| Immigrants | Cabo Verde | 0.0 /100 | #342 | Tragic $46,654 |
| Immigrants | Dominican Republic | 0.0 /100 | #343 | Tragic $45,758 |
| Houma | 0.0 /100 | #344 | Tragic $44,822 |
| Immigrants | Cuba | 0.0 /100 | #345 | Tragic $44,735 |
| Puerto Ricans | 0.0 /100 | #346 | Tragic $42,550 |
| Lumbee | 0.0 /100 | #347 | Tragic $40,550 |