West Indian vs Puerto Rican Householder Income Over 65 years
COMPARE
West Indian
Puerto Rican
Householder Income Over 65 years
Householder Income Over 65 years Comparison
West Indians
Puerto Ricans
$54,936
HOUSEHOLDER INCOME OVER 65 YEARS
0.2/ 100
METRIC RATING
259th/ 347
METRIC RANK
$42,550
HOUSEHOLDER INCOME OVER 65 YEARS
0.0/ 100
METRIC RATING
346th/ 347
METRIC RANK
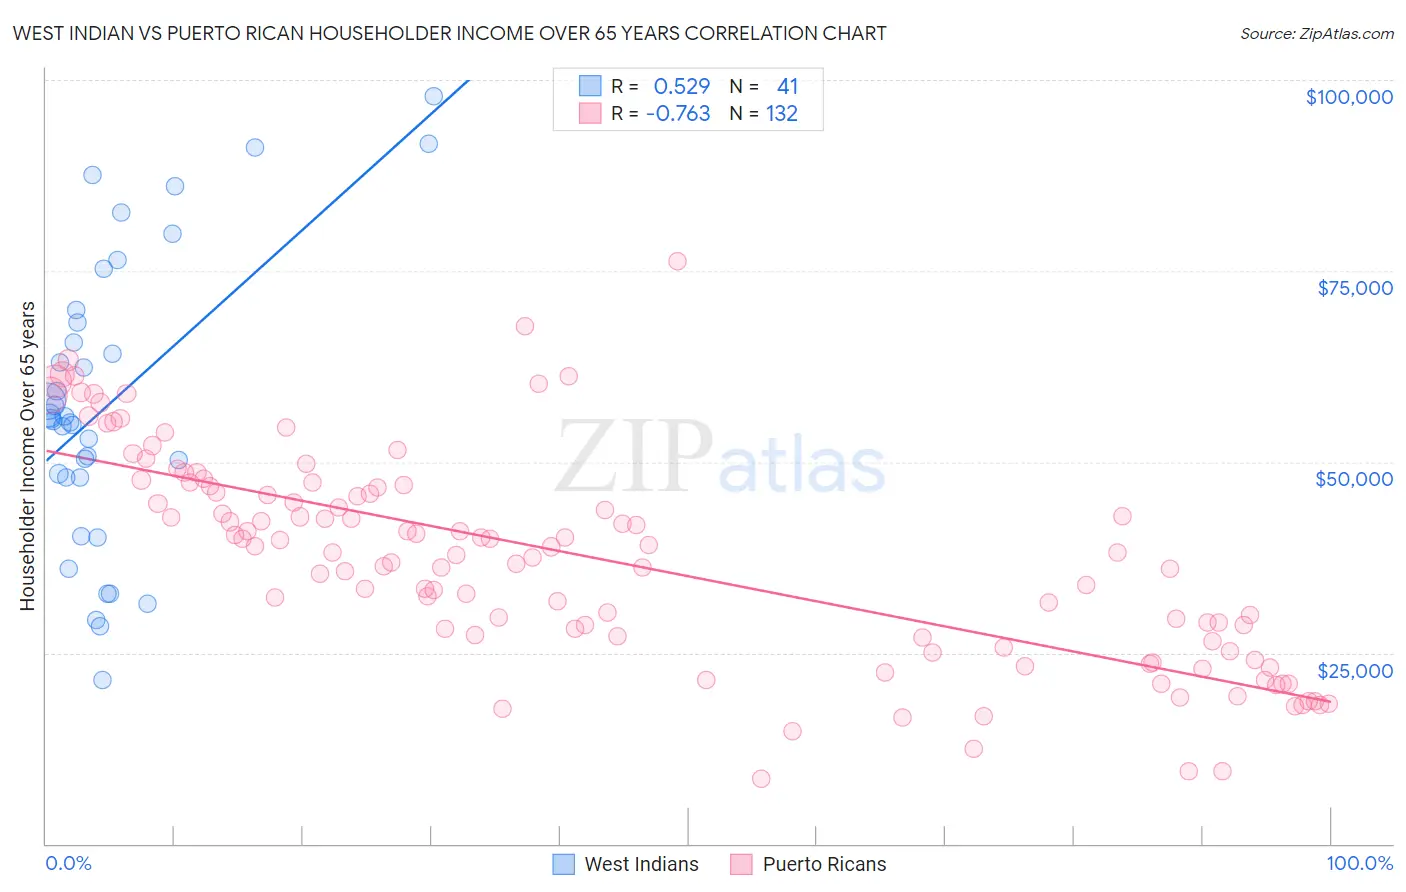
West Indian vs Puerto Rican Householder Income Over 65 years Correlation Chart
The statistical analysis conducted on geographies consisting of 253,324,861 people shows a substantial positive correlation between the proportion of West Indians and household income with householder over the age of 65 in the United States with a correlation coefficient (R) of 0.529 and weighted average of $54,936. Similarly, the statistical analysis conducted on geographies consisting of 524,809,203 people shows a strong negative correlation between the proportion of Puerto Ricans and household income with householder over the age of 65 in the United States with a correlation coefficient (R) of -0.763 and weighted average of $42,550, a difference of 29.1%.
Householder Income Over 65 years Correlation Summary
| Measurement | West Indian | Puerto Rican |
| Minimum | $21,368 | $8,529 |
| Maximum | $97,868 | $76,277 |
| Range | $76,500 | $67,748 |
| Mean | $57,688 | $37,319 |
| Median | $55,650 | $38,145 |
| Interquartile 25% (IQ1) | $47,931 | $26,777 |
| Interquartile 75% (IQ3) | $69,062 | $46,716 |
| Interquartile Range (IQR) | $21,132 | $19,939 |
| Standard Deviation (Sample) | $18,888 | $13,872 |
| Standard Deviation (Population) | $18,656 | $13,820 |
Similar Demographics by Householder Income Over 65 years
Demographics Similar to West Indians by Householder Income Over 65 years
In terms of householder income over 65 years, the demographic groups most similar to West Indians are Immigrants from West Indies ($54,927, a difference of 0.020%), Comanche ($54,922, a difference of 0.030%), Ecuadorian ($54,958, a difference of 0.040%), Bangladeshi ($54,719, a difference of 0.40%), and French American Indian ($54,699, a difference of 0.43%).
| Demographics | Rating | Rank | Householder Income Over 65 years |
| Osage | 0.4 /100 | #252 | Tragic $55,677 |
| Immigrants | Trinidad and Tobago | 0.4 /100 | #253 | Tragic $55,598 |
| Americans | 0.3 /100 | #254 | Tragic $55,527 |
| Immigrants | Bangladesh | 0.3 /100 | #255 | Tragic $55,394 |
| German Russians | 0.3 /100 | #256 | Tragic $55,356 |
| Trinidadians and Tobagonians | 0.3 /100 | #257 | Tragic $55,327 |
| Ecuadorians | 0.2 /100 | #258 | Tragic $54,958 |
| West Indians | 0.2 /100 | #259 | Tragic $54,936 |
| Immigrants | West Indies | 0.2 /100 | #260 | Tragic $54,927 |
| Comanche | 0.2 /100 | #261 | Tragic $54,922 |
| Bangladeshis | 0.1 /100 | #262 | Tragic $54,719 |
| French American Indians | 0.1 /100 | #263 | Tragic $54,699 |
| Apache | 0.1 /100 | #264 | Tragic $54,668 |
| Belizeans | 0.1 /100 | #265 | Tragic $54,580 |
| Jamaicans | 0.1 /100 | #266 | Tragic $54,560 |
Demographics Similar to Puerto Ricans by Householder Income Over 65 years
In terms of householder income over 65 years, the demographic groups most similar to Puerto Ricans are Lumbee ($40,550, a difference of 4.9%), Immigrants from Cuba ($44,735, a difference of 5.1%), Houma ($44,822, a difference of 5.3%), Immigrants from Dominican Republic ($45,758, a difference of 7.5%), and Immigrants from Cabo Verde ($46,654, a difference of 9.7%).
| Demographics | Rating | Rank | Householder Income Over 65 years |
| Cape Verdeans | 0.0 /100 | #333 | Tragic $50,077 |
| Immigrants | Dominica | 0.0 /100 | #334 | Tragic $50,071 |
| Crow | 0.0 /100 | #335 | Tragic $49,234 |
| Cubans | 0.0 /100 | #336 | Tragic $49,152 |
| Tohono O'odham | 0.0 /100 | #337 | Tragic $49,121 |
| Immigrants | Caribbean | 0.0 /100 | #338 | Tragic $48,535 |
| Navajo | 0.0 /100 | #339 | Tragic $47,722 |
| Immigrants | Yemen | 0.0 /100 | #340 | Tragic $47,527 |
| Dominicans | 0.0 /100 | #341 | Tragic $46,964 |
| Immigrants | Cabo Verde | 0.0 /100 | #342 | Tragic $46,654 |
| Immigrants | Dominican Republic | 0.0 /100 | #343 | Tragic $45,758 |
| Houma | 0.0 /100 | #344 | Tragic $44,822 |
| Immigrants | Cuba | 0.0 /100 | #345 | Tragic $44,735 |
| Puerto Ricans | 0.0 /100 | #346 | Tragic $42,550 |
| Lumbee | 0.0 /100 | #347 | Tragic $40,550 |