Bolivian vs Puerto Rican Householder Income Over 65 years
COMPARE
Bolivian
Puerto Rican
Householder Income Over 65 years
Householder Income Over 65 years Comparison
Bolivians
Puerto Ricans
$74,245
HOUSEHOLDER INCOME OVER 65 YEARS
100.0/ 100
METRIC RATING
6th/ 347
METRIC RANK
$42,550
HOUSEHOLDER INCOME OVER 65 YEARS
0.0/ 100
METRIC RATING
346th/ 347
METRIC RANK
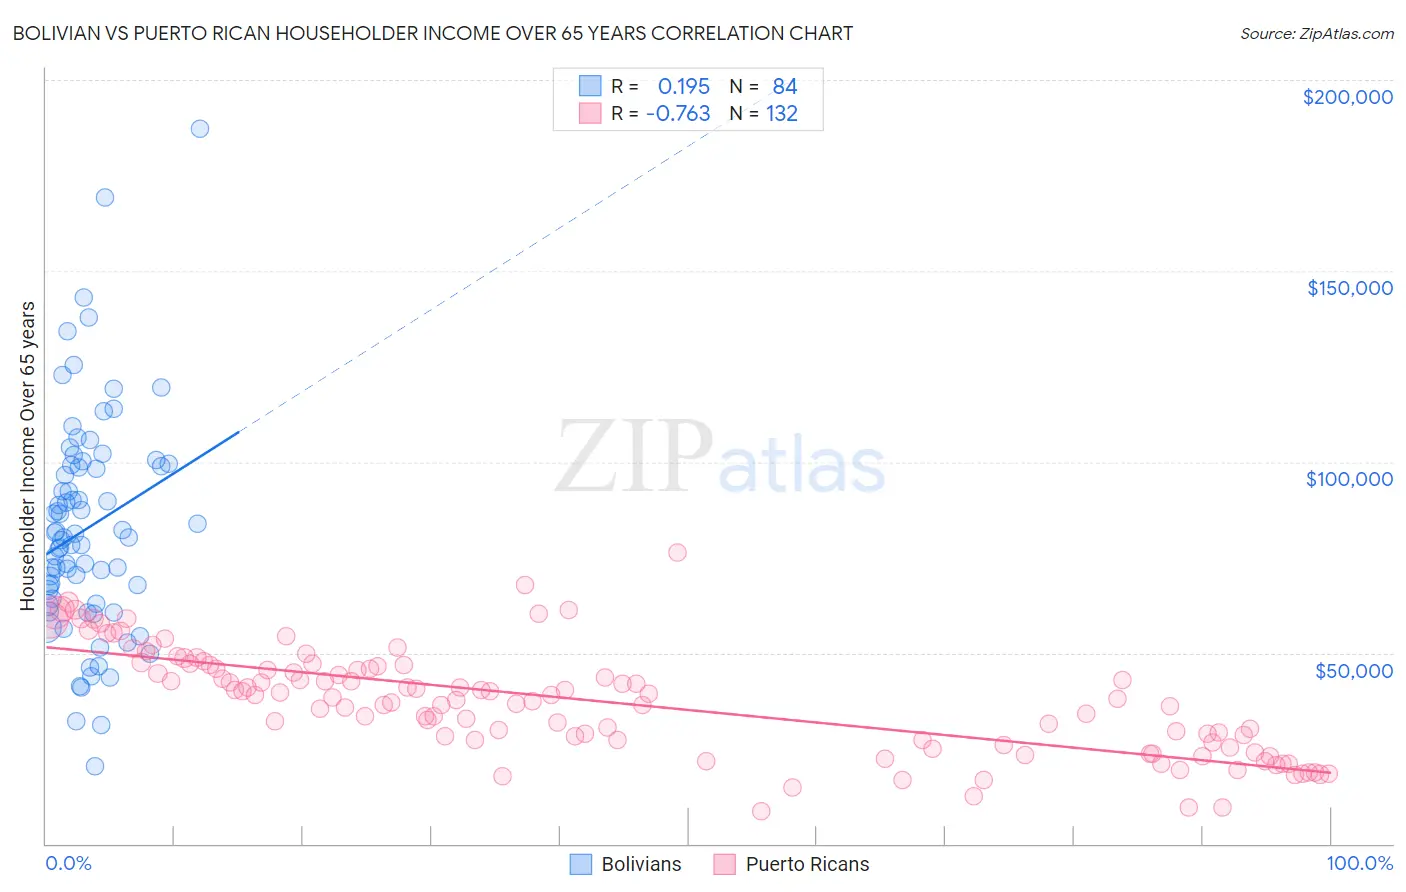
Bolivian vs Puerto Rican Householder Income Over 65 years Correlation Chart
The statistical analysis conducted on geographies consisting of 184,404,037 people shows a poor positive correlation between the proportion of Bolivians and household income with householder over the age of 65 in the United States with a correlation coefficient (R) of 0.195 and weighted average of $74,245. Similarly, the statistical analysis conducted on geographies consisting of 524,809,203 people shows a strong negative correlation between the proportion of Puerto Ricans and household income with householder over the age of 65 in the United States with a correlation coefficient (R) of -0.763 and weighted average of $42,550, a difference of 74.5%.
Householder Income Over 65 years Correlation Summary
| Measurement | Bolivian | Puerto Rican |
| Minimum | $20,142 | $8,529 |
| Maximum | $187,273 | $76,277 |
| Range | $167,131 | $67,748 |
| Mean | $82,611 | $37,319 |
| Median | $80,185 | $38,145 |
| Interquartile 25% (IQ1) | $63,404 | $26,777 |
| Interquartile 75% (IQ3) | $98,957 | $46,716 |
| Interquartile Range (IQR) | $35,553 | $19,939 |
| Standard Deviation (Sample) | $29,052 | $13,872 |
| Standard Deviation (Population) | $28,879 | $13,820 |
Similar Demographics by Householder Income Over 65 years
Demographics Similar to Bolivians by Householder Income Over 65 years
In terms of householder income over 65 years, the demographic groups most similar to Bolivians are Immigrants from Bolivia ($73,434, a difference of 1.1%), Immigrants from Iran ($75,081, a difference of 1.1%), Immigrants from Singapore ($72,963, a difference of 1.8%), Immigrants from India ($72,804, a difference of 2.0%), and Bhutanese ($72,288, a difference of 2.7%).
| Demographics | Rating | Rank | Householder Income Over 65 years |
| Chinese | 100.0 /100 | #1 | Exceptional $77,465 |
| Iranians | 100.0 /100 | #2 | Exceptional $77,429 |
| Immigrants | Taiwan | 100.0 /100 | #3 | Exceptional $77,051 |
| Filipinos | 100.0 /100 | #4 | Exceptional $76,686 |
| Immigrants | Iran | 100.0 /100 | #5 | Exceptional $75,081 |
| Bolivians | 100.0 /100 | #6 | Exceptional $74,245 |
| Immigrants | Bolivia | 100.0 /100 | #7 | Exceptional $73,434 |
| Immigrants | Singapore | 100.0 /100 | #8 | Exceptional $72,963 |
| Immigrants | India | 100.0 /100 | #9 | Exceptional $72,804 |
| Bhutanese | 100.0 /100 | #10 | Exceptional $72,288 |
| Thais | 100.0 /100 | #11 | Exceptional $72,099 |
| Cypriots | 100.0 /100 | #12 | Exceptional $71,714 |
| Immigrants | Hong Kong | 100.0 /100 | #13 | Exceptional $71,567 |
| Burmese | 100.0 /100 | #14 | Exceptional $71,139 |
| Native Hawaiians | 100.0 /100 | #15 | Exceptional $71,021 |
Demographics Similar to Puerto Ricans by Householder Income Over 65 years
In terms of householder income over 65 years, the demographic groups most similar to Puerto Ricans are Lumbee ($40,550, a difference of 4.9%), Immigrants from Cuba ($44,735, a difference of 5.1%), Houma ($44,822, a difference of 5.3%), Immigrants from Dominican Republic ($45,758, a difference of 7.5%), and Immigrants from Cabo Verde ($46,654, a difference of 9.7%).
| Demographics | Rating | Rank | Householder Income Over 65 years |
| Cape Verdeans | 0.0 /100 | #333 | Tragic $50,077 |
| Immigrants | Dominica | 0.0 /100 | #334 | Tragic $50,071 |
| Crow | 0.0 /100 | #335 | Tragic $49,234 |
| Cubans | 0.0 /100 | #336 | Tragic $49,152 |
| Tohono O'odham | 0.0 /100 | #337 | Tragic $49,121 |
| Immigrants | Caribbean | 0.0 /100 | #338 | Tragic $48,535 |
| Navajo | 0.0 /100 | #339 | Tragic $47,722 |
| Immigrants | Yemen | 0.0 /100 | #340 | Tragic $47,527 |
| Dominicans | 0.0 /100 | #341 | Tragic $46,964 |
| Immigrants | Cabo Verde | 0.0 /100 | #342 | Tragic $46,654 |
| Immigrants | Dominican Republic | 0.0 /100 | #343 | Tragic $45,758 |
| Houma | 0.0 /100 | #344 | Tragic $44,822 |
| Immigrants | Cuba | 0.0 /100 | #345 | Tragic $44,735 |
| Puerto Ricans | 0.0 /100 | #346 | Tragic $42,550 |
| Lumbee | 0.0 /100 | #347 | Tragic $40,550 |