Immigrants from Italy vs Puerto Rican Householder Income Over 65 years
COMPARE
Immigrants from Italy
Puerto Rican
Householder Income Over 65 years
Householder Income Over 65 years Comparison
Immigrants from Italy
Puerto Ricans
$64,065
HOUSEHOLDER INCOME OVER 65 YEARS
96.2/ 100
METRIC RATING
101st/ 347
METRIC RANK
$42,550
HOUSEHOLDER INCOME OVER 65 YEARS
0.0/ 100
METRIC RATING
346th/ 347
METRIC RANK
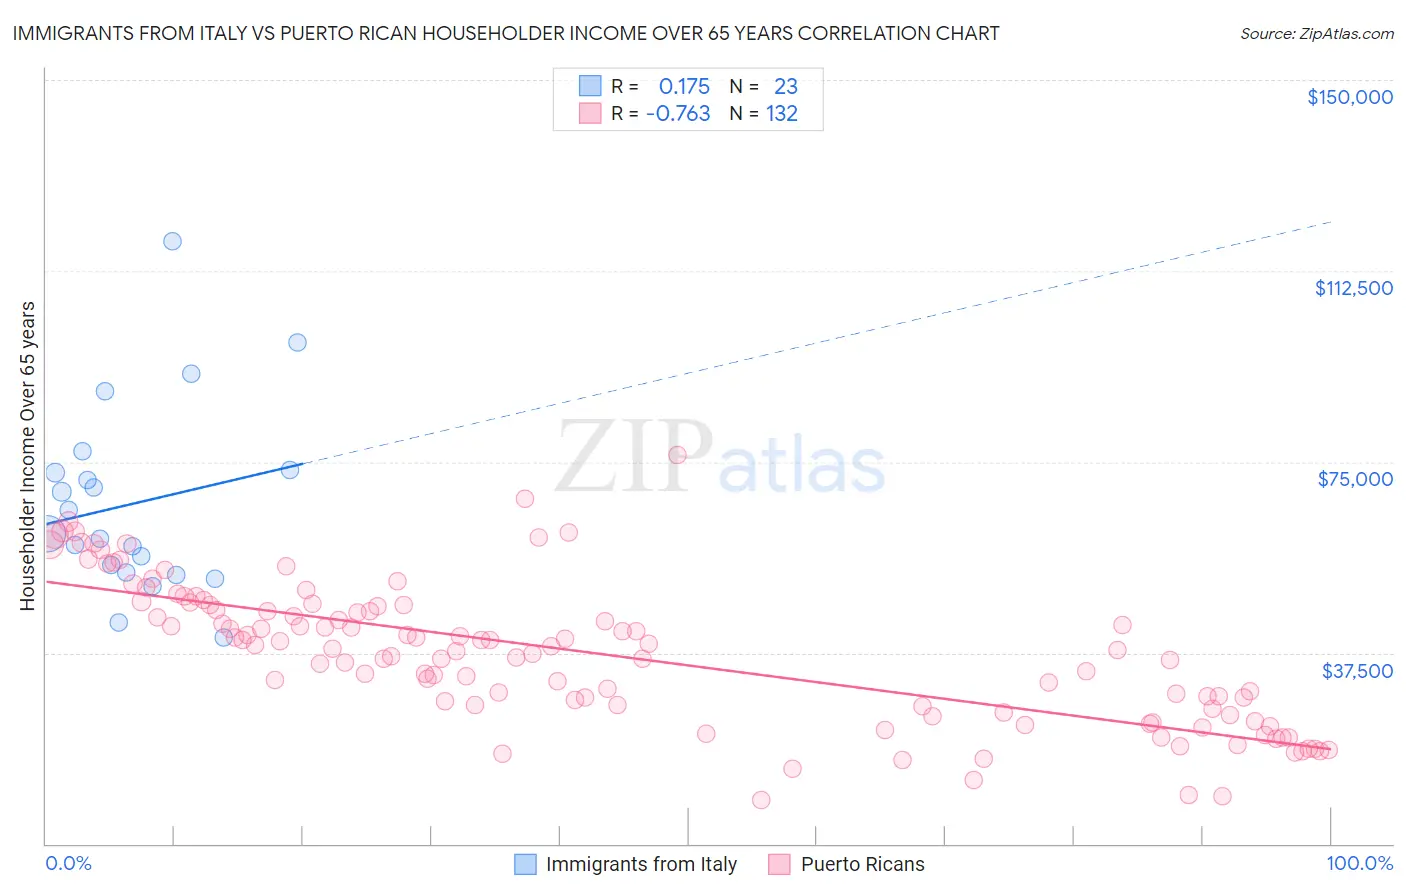
Immigrants from Italy vs Puerto Rican Householder Income Over 65 years Correlation Chart
The statistical analysis conducted on geographies consisting of 323,658,132 people shows a poor positive correlation between the proportion of Immigrants from Italy and household income with householder over the age of 65 in the United States with a correlation coefficient (R) of 0.175 and weighted average of $64,065. Similarly, the statistical analysis conducted on geographies consisting of 524,809,203 people shows a strong negative correlation between the proportion of Puerto Ricans and household income with householder over the age of 65 in the United States with a correlation coefficient (R) of -0.763 and weighted average of $42,550, a difference of 50.6%.
Householder Income Over 65 years Correlation Summary
| Measurement | Immigrants from Italy | Puerto Rican |
| Minimum | $40,625 | $8,529 |
| Maximum | $118,263 | $76,277 |
| Range | $77,638 | $67,748 |
| Mean | $66,915 | $37,319 |
| Median | $60,782 | $38,145 |
| Interquartile 25% (IQ1) | $53,273 | $26,777 |
| Interquartile 75% (IQ3) | $73,333 | $46,716 |
| Interquartile Range (IQR) | $20,060 | $19,939 |
| Standard Deviation (Sample) | $18,554 | $13,872 |
| Standard Deviation (Population) | $18,146 | $13,820 |
Similar Demographics by Householder Income Over 65 years
Demographics Similar to Immigrants from Italy by Householder Income Over 65 years
In terms of householder income over 65 years, the demographic groups most similar to Immigrants from Italy are Immigrants from South Eastern Asia ($64,089, a difference of 0.040%), Assyrian/Chaldean/Syriac ($64,108, a difference of 0.070%), Romanian ($64,142, a difference of 0.12%), Chilean ($63,957, a difference of 0.17%), and British ($63,940, a difference of 0.20%).
| Demographics | Rating | Rank | Householder Income Over 65 years |
| Immigrants | Egypt | 97.0 /100 | #94 | Exceptional $64,299 |
| Immigrants | Latvia | 97.0 /100 | #95 | Exceptional $64,298 |
| Immigrants | Hungary | 97.0 /100 | #96 | Exceptional $64,277 |
| Sri Lankans | 96.7 /100 | #97 | Exceptional $64,201 |
| Romanians | 96.5 /100 | #98 | Exceptional $64,142 |
| Assyrians/Chaldeans/Syriacs | 96.4 /100 | #99 | Exceptional $64,108 |
| Immigrants | South Eastern Asia | 96.3 /100 | #100 | Exceptional $64,089 |
| Immigrants | Italy | 96.2 /100 | #101 | Exceptional $64,065 |
| Chileans | 95.8 /100 | #102 | Exceptional $63,957 |
| British | 95.7 /100 | #103 | Exceptional $63,940 |
| Immigrants | Cameroon | 95.6 /100 | #104 | Exceptional $63,907 |
| Italians | 95.5 /100 | #105 | Exceptional $63,885 |
| Immigrants | Argentina | 95.5 /100 | #106 | Exceptional $63,885 |
| Pakistanis | 95.3 /100 | #107 | Exceptional $63,844 |
| Palestinians | 95.1 /100 | #108 | Exceptional $63,800 |
Demographics Similar to Puerto Ricans by Householder Income Over 65 years
In terms of householder income over 65 years, the demographic groups most similar to Puerto Ricans are Lumbee ($40,550, a difference of 4.9%), Immigrants from Cuba ($44,735, a difference of 5.1%), Houma ($44,822, a difference of 5.3%), Immigrants from Dominican Republic ($45,758, a difference of 7.5%), and Immigrants from Cabo Verde ($46,654, a difference of 9.7%).
| Demographics | Rating | Rank | Householder Income Over 65 years |
| Cape Verdeans | 0.0 /100 | #333 | Tragic $50,077 |
| Immigrants | Dominica | 0.0 /100 | #334 | Tragic $50,071 |
| Crow | 0.0 /100 | #335 | Tragic $49,234 |
| Cubans | 0.0 /100 | #336 | Tragic $49,152 |
| Tohono O'odham | 0.0 /100 | #337 | Tragic $49,121 |
| Immigrants | Caribbean | 0.0 /100 | #338 | Tragic $48,535 |
| Navajo | 0.0 /100 | #339 | Tragic $47,722 |
| Immigrants | Yemen | 0.0 /100 | #340 | Tragic $47,527 |
| Dominicans | 0.0 /100 | #341 | Tragic $46,964 |
| Immigrants | Cabo Verde | 0.0 /100 | #342 | Tragic $46,654 |
| Immigrants | Dominican Republic | 0.0 /100 | #343 | Tragic $45,758 |
| Houma | 0.0 /100 | #344 | Tragic $44,822 |
| Immigrants | Cuba | 0.0 /100 | #345 | Tragic $44,735 |
| Puerto Ricans | 0.0 /100 | #346 | Tragic $42,550 |
| Lumbee | 0.0 /100 | #347 | Tragic $40,550 |