Immigrants from Poland vs Albanian Householder Income Ages 45 - 64 years
COMPARE
Immigrants from Poland
Albanian
Householder Income Ages 45 - 64 years
Householder Income Ages 45 - 64 years Comparison
Immigrants from Poland
Albanians
$106,319
HOUSEHOLDER INCOME AGES 45 - 64 YEARS
95.3/ 100
METRIC RATING
114th/ 347
METRIC RANK
$106,243
HOUSEHOLDER INCOME AGES 45 - 64 YEARS
95.1/ 100
METRIC RATING
117th/ 347
METRIC RANK
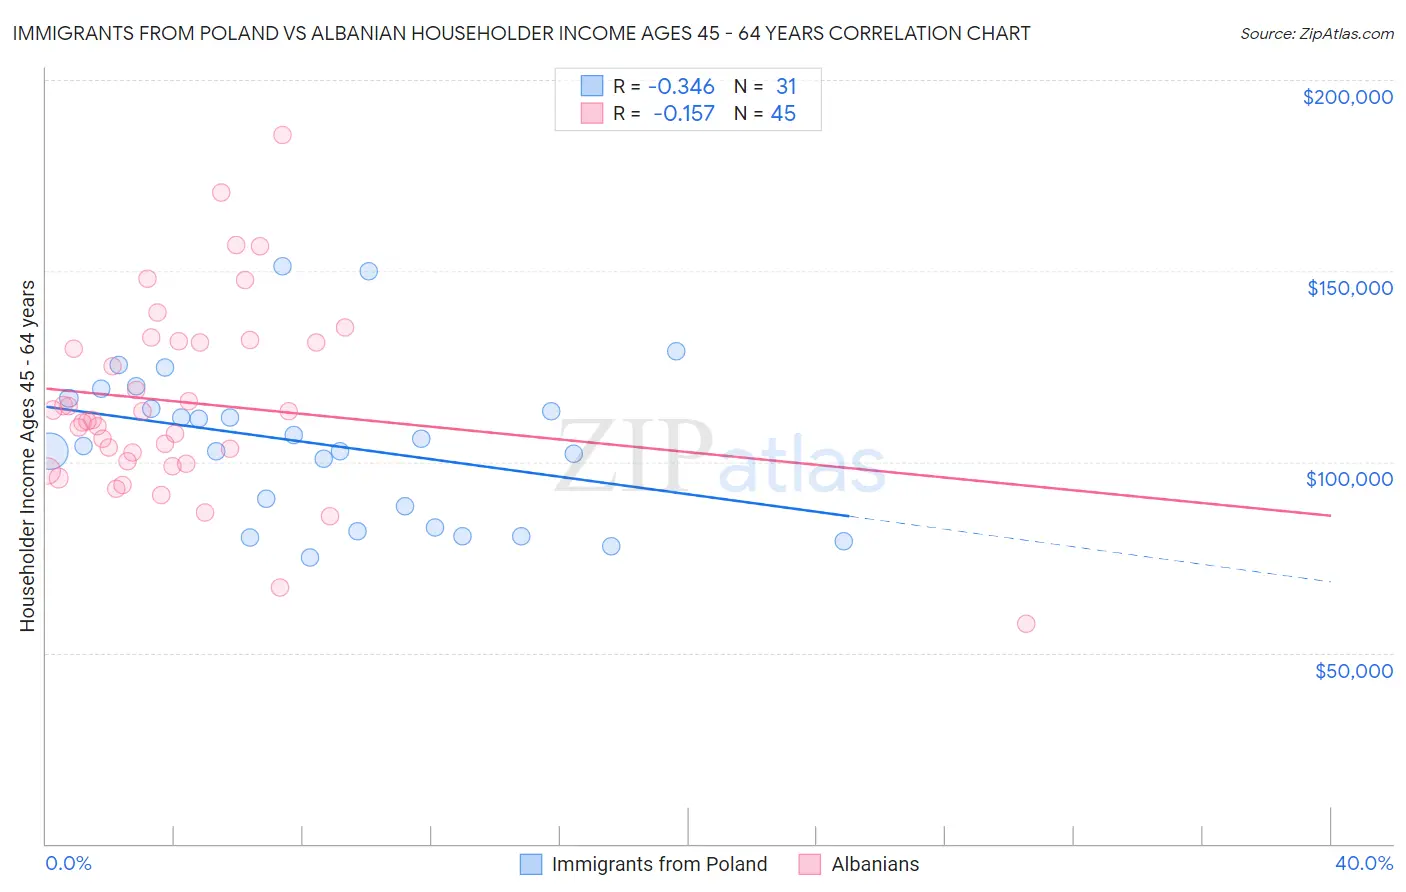
Immigrants from Poland vs Albanian Householder Income Ages 45 - 64 years Correlation Chart
The statistical analysis conducted on geographies consisting of 304,578,268 people shows a mild negative correlation between the proportion of Immigrants from Poland and household income with householder between the ages 45 and 64 in the United States with a correlation coefficient (R) of -0.346 and weighted average of $106,319. Similarly, the statistical analysis conducted on geographies consisting of 193,108,072 people shows a poor negative correlation between the proportion of Albanians and household income with householder between the ages 45 and 64 in the United States with a correlation coefficient (R) of -0.157 and weighted average of $106,243, a difference of 0.070%.
Householder Income Ages 45 - 64 years Correlation Summary
| Measurement | Immigrants from Poland | Albanian |
| Minimum | $74,827 | $57,692 |
| Maximum | $151,262 | $185,625 |
| Range | $76,436 | $127,933 |
| Mean | $104,596 | $115,620 |
| Median | $104,115 | $111,029 |
| Interquartile 25% (IQ1) | $82,959 | $99,857 |
| Interquartile 75% (IQ3) | $116,688 | $131,426 |
| Interquartile Range (IQR) | $33,729 | $31,568 |
| Standard Deviation (Sample) | $20,034 | $24,903 |
| Standard Deviation (Population) | $19,708 | $24,625 |
Demographics Similar to Immigrants from Poland and Albanians by Householder Income Ages 45 - 64 years
In terms of householder income ages 45 - 64 years, the demographic groups most similar to Immigrants from Poland are Immigrants from Kuwait ($106,285, a difference of 0.030%), European ($106,367, a difference of 0.050%), British ($106,264, a difference of 0.050%), Swedish ($106,377, a difference of 0.060%), and Immigrants from Vietnam ($106,417, a difference of 0.090%). Similarly, the demographic groups most similar to Albanians are British ($106,264, a difference of 0.020%), Immigrants from Western Asia ($106,217, a difference of 0.020%), Immigrants from Kuwait ($106,285, a difference of 0.040%), Immigrants from Jordan ($106,164, a difference of 0.070%), and European ($106,367, a difference of 0.12%).
| Demographics | Rating | Rank | Householder Income Ages 45 - 64 years |
| Macedonians | 96.7 /100 | #105 | Exceptional $107,074 |
| Armenians | 96.6 /100 | #106 | Exceptional $107,002 |
| Immigrants | Fiji | 96.5 /100 | #107 | Exceptional $106,952 |
| Zimbabweans | 96.3 /100 | #108 | Exceptional $106,849 |
| Chileans | 95.9 /100 | #109 | Exceptional $106,611 |
| Immigrants | Brazil | 95.6 /100 | #110 | Exceptional $106,470 |
| Immigrants | Vietnam | 95.5 /100 | #111 | Exceptional $106,417 |
| Swedes | 95.4 /100 | #112 | Exceptional $106,377 |
| Europeans | 95.4 /100 | #113 | Exceptional $106,367 |
| Immigrants | Poland | 95.3 /100 | #114 | Exceptional $106,319 |
| Immigrants | Kuwait | 95.2 /100 | #115 | Exceptional $106,285 |
| British | 95.2 /100 | #116 | Exceptional $106,264 |
| Albanians | 95.1 /100 | #117 | Exceptional $106,243 |
| Immigrants | Western Asia | 95.0 /100 | #118 | Exceptional $106,217 |
| Immigrants | Jordan | 94.9 /100 | #119 | Exceptional $106,164 |
| Immigrants | South Eastern Asia | 94.8 /100 | #120 | Exceptional $106,109 |
| Poles | 94.4 /100 | #121 | Exceptional $105,952 |
| Immigrants | North Macedonia | 94.2 /100 | #122 | Exceptional $105,892 |
| Danes | 93.4 /100 | #123 | Exceptional $105,619 |
| Immigrants | Northern Africa | 92.8 /100 | #124 | Exceptional $105,430 |
| Pakistanis | 92.4 /100 | #125 | Exceptional $105,317 |