Immigrants from Poland vs Colombian Householder Income Ages 45 - 64 years
COMPARE
Immigrants from Poland
Colombian
Householder Income Ages 45 - 64 years
Householder Income Ages 45 - 64 years Comparison
Immigrants from Poland
Colombians
$106,319
HOUSEHOLDER INCOME AGES 45 - 64 YEARS
95.3/ 100
METRIC RATING
114th/ 347
METRIC RANK
$99,772
HOUSEHOLDER INCOME AGES 45 - 64 YEARS
43.2/ 100
METRIC RATING
185th/ 347
METRIC RANK
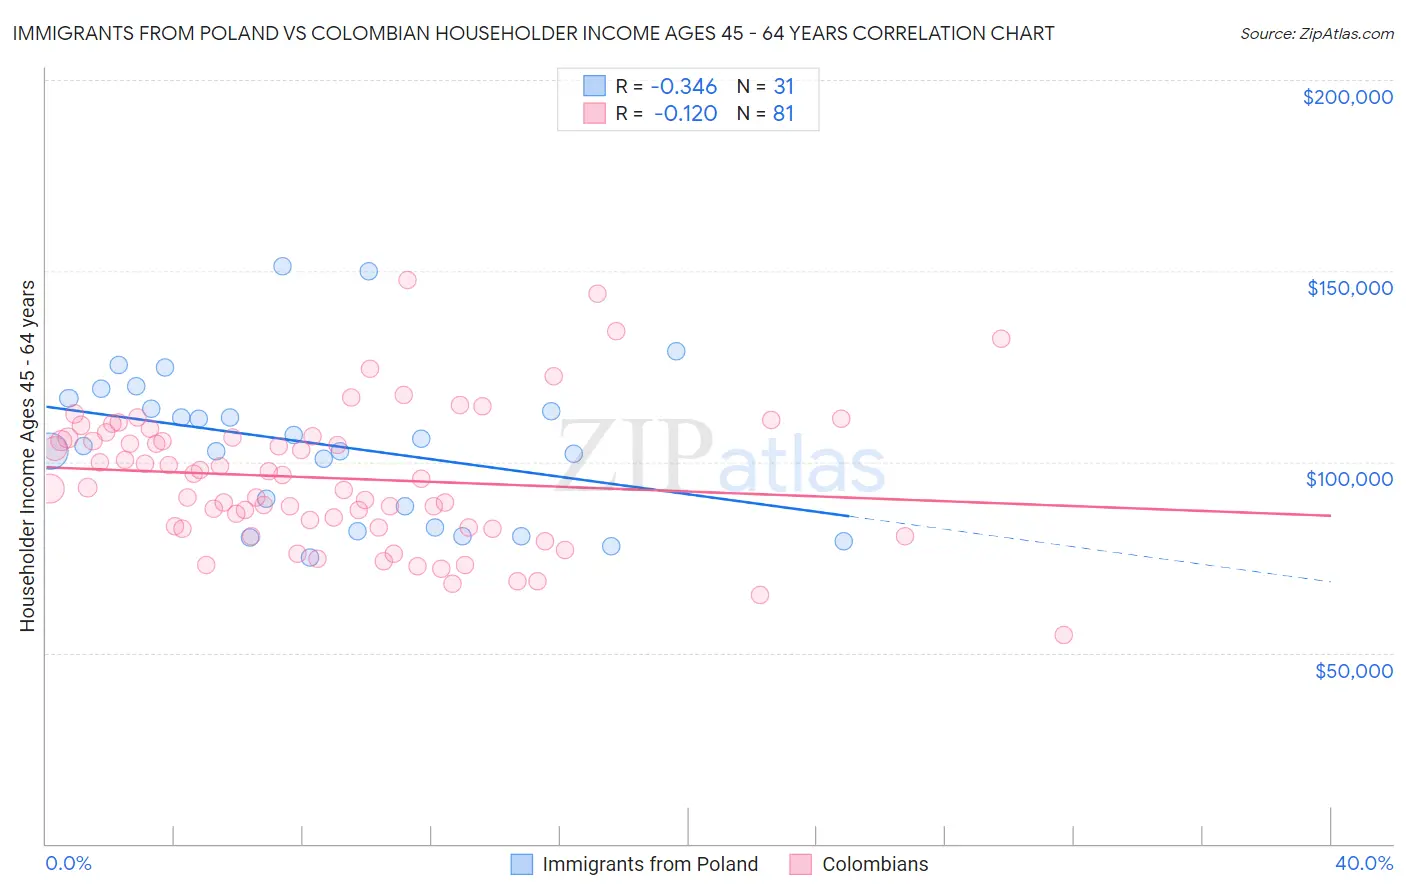
Immigrants from Poland vs Colombian Householder Income Ages 45 - 64 years Correlation Chart
The statistical analysis conducted on geographies consisting of 304,578,268 people shows a mild negative correlation between the proportion of Immigrants from Poland and household income with householder between the ages 45 and 64 in the United States with a correlation coefficient (R) of -0.346 and weighted average of $106,319. Similarly, the statistical analysis conducted on geographies consisting of 418,806,798 people shows a poor negative correlation between the proportion of Colombians and household income with householder between the ages 45 and 64 in the United States with a correlation coefficient (R) of -0.120 and weighted average of $99,772, a difference of 6.6%.
Householder Income Ages 45 - 64 years Correlation Summary
| Measurement | Immigrants from Poland | Colombian |
| Minimum | $74,827 | $54,659 |
| Maximum | $151,262 | $147,591 |
| Range | $76,436 | $92,932 |
| Mean | $104,596 | $95,720 |
| Median | $104,115 | $95,478 |
| Interquartile 25% (IQ1) | $82,959 | $82,814 |
| Interquartile 75% (IQ3) | $116,688 | $106,476 |
| Interquartile Range (IQR) | $33,729 | $23,662 |
| Standard Deviation (Sample) | $20,034 | $17,882 |
| Standard Deviation (Population) | $19,708 | $17,771 |
Similar Demographics by Householder Income Ages 45 - 64 years
Demographics Similar to Immigrants from Poland by Householder Income Ages 45 - 64 years
In terms of householder income ages 45 - 64 years, the demographic groups most similar to Immigrants from Poland are Immigrants from Kuwait ($106,285, a difference of 0.030%), European ($106,367, a difference of 0.050%), British ($106,264, a difference of 0.050%), Swedish ($106,377, a difference of 0.060%), and Albanian ($106,243, a difference of 0.070%).
| Demographics | Rating | Rank | Householder Income Ages 45 - 64 years |
| Immigrants | Fiji | 96.5 /100 | #107 | Exceptional $106,952 |
| Zimbabweans | 96.3 /100 | #108 | Exceptional $106,849 |
| Chileans | 95.9 /100 | #109 | Exceptional $106,611 |
| Immigrants | Brazil | 95.6 /100 | #110 | Exceptional $106,470 |
| Immigrants | Vietnam | 95.5 /100 | #111 | Exceptional $106,417 |
| Swedes | 95.4 /100 | #112 | Exceptional $106,377 |
| Europeans | 95.4 /100 | #113 | Exceptional $106,367 |
| Immigrants | Poland | 95.3 /100 | #114 | Exceptional $106,319 |
| Immigrants | Kuwait | 95.2 /100 | #115 | Exceptional $106,285 |
| British | 95.2 /100 | #116 | Exceptional $106,264 |
| Albanians | 95.1 /100 | #117 | Exceptional $106,243 |
| Immigrants | Western Asia | 95.0 /100 | #118 | Exceptional $106,217 |
| Immigrants | Jordan | 94.9 /100 | #119 | Exceptional $106,164 |
| Immigrants | South Eastern Asia | 94.8 /100 | #120 | Exceptional $106,109 |
| Poles | 94.4 /100 | #121 | Exceptional $105,952 |
Demographics Similar to Colombians by Householder Income Ages 45 - 64 years
In terms of householder income ages 45 - 64 years, the demographic groups most similar to Colombians are French ($99,824, a difference of 0.050%), Spaniard ($99,889, a difference of 0.12%), Dutch ($99,650, a difference of 0.12%), Finnish ($99,904, a difference of 0.13%), and Immigrants ($99,943, a difference of 0.17%).
| Demographics | Rating | Rank | Householder Income Ages 45 - 64 years |
| Immigrants | Cameroon | 47.0 /100 | #178 | Average $100,084 |
| Belgians | 46.7 /100 | #179 | Average $100,060 |
| Aleuts | 46.6 /100 | #180 | Average $100,052 |
| Immigrants | Immigrants | 45.3 /100 | #181 | Average $99,943 |
| Finns | 44.8 /100 | #182 | Average $99,904 |
| Spaniards | 44.6 /100 | #183 | Average $99,889 |
| French | 43.8 /100 | #184 | Average $99,824 |
| Colombians | 43.2 /100 | #185 | Average $99,772 |
| Dutch | 41.7 /100 | #186 | Average $99,650 |
| Iraqis | 38.5 /100 | #187 | Fair $99,387 |
| Immigrants | Portugal | 36.3 /100 | #188 | Fair $99,203 |
| Immigrants | South America | 35.4 /100 | #189 | Fair $99,126 |
| French Canadians | 35.1 /100 | #190 | Fair $99,093 |
| Kenyans | 33.7 /100 | #191 | Fair $98,970 |
| Celtics | 32.9 /100 | #192 | Fair $98,896 |