Immigrants from Poland vs Asian Householder Income Ages 45 - 64 years
COMPARE
Immigrants from Poland
Asian
Householder Income Ages 45 - 64 years
Householder Income Ages 45 - 64 years Comparison
Immigrants from Poland
Asians
$106,319
HOUSEHOLDER INCOME AGES 45 - 64 YEARS
95.3/ 100
METRIC RATING
114th/ 347
METRIC RANK
$118,426
HOUSEHOLDER INCOME AGES 45 - 64 YEARS
100.0/ 100
METRIC RATING
25th/ 347
METRIC RANK
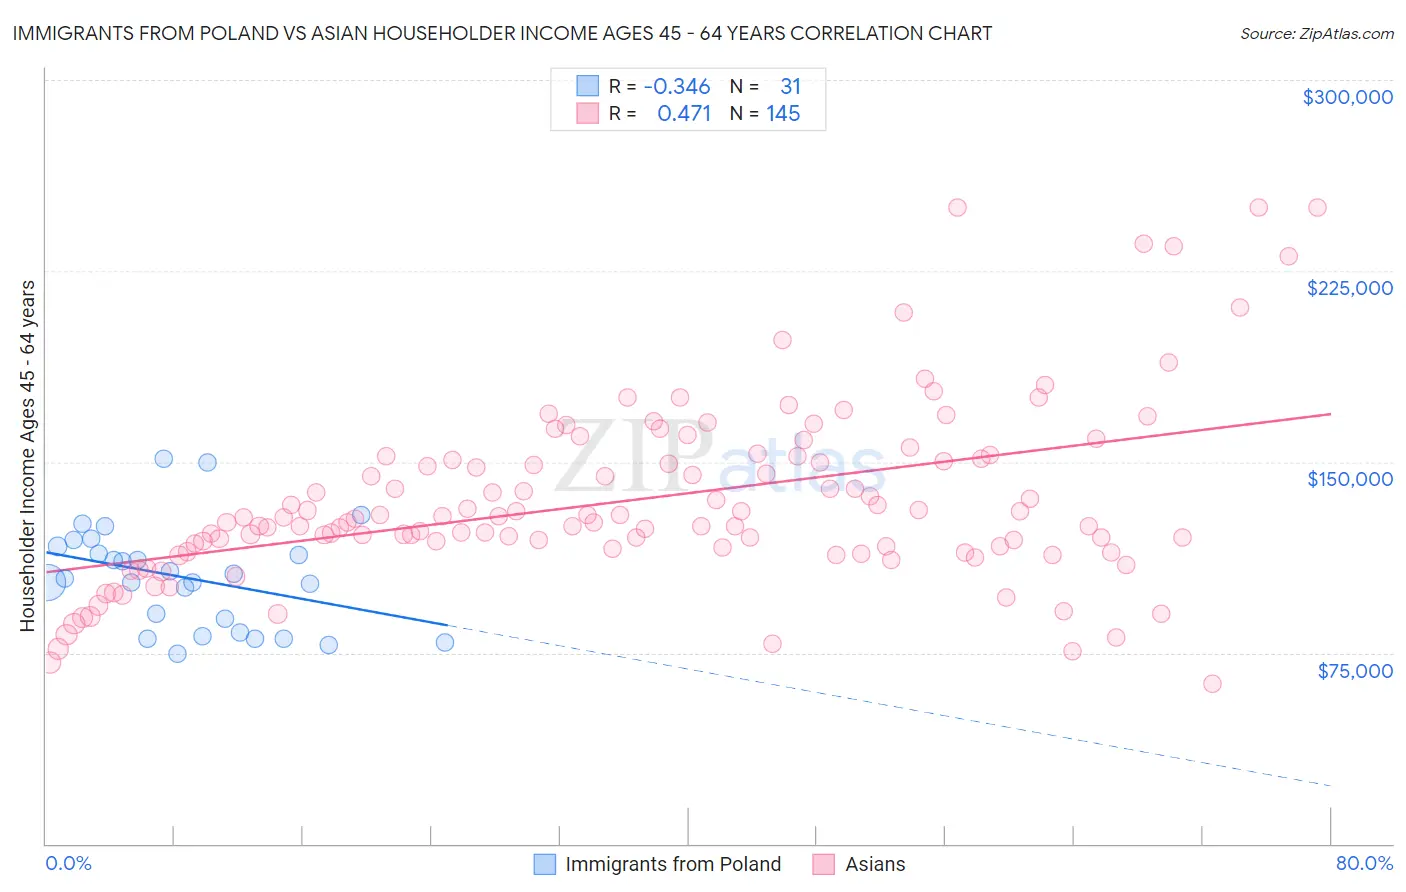
Immigrants from Poland vs Asian Householder Income Ages 45 - 64 years Correlation Chart
The statistical analysis conducted on geographies consisting of 304,578,268 people shows a mild negative correlation between the proportion of Immigrants from Poland and household income with householder between the ages 45 and 64 in the United States with a correlation coefficient (R) of -0.346 and weighted average of $106,319. Similarly, the statistical analysis conducted on geographies consisting of 548,262,581 people shows a moderate positive correlation between the proportion of Asians and household income with householder between the ages 45 and 64 in the United States with a correlation coefficient (R) of 0.471 and weighted average of $118,426, a difference of 11.4%.
Householder Income Ages 45 - 64 years Correlation Summary
| Measurement | Immigrants from Poland | Asian |
| Minimum | $74,827 | $62,982 |
| Maximum | $151,262 | $250,001 |
| Range | $76,436 | $187,019 |
| Mean | $104,596 | $135,000 |
| Median | $104,115 | $127,763 |
| Interquartile 25% (IQ1) | $82,959 | $116,265 |
| Interquartile 75% (IQ3) | $116,688 | $151,736 |
| Interquartile Range (IQR) | $33,729 | $35,471 |
| Standard Deviation (Sample) | $20,034 | $35,213 |
| Standard Deviation (Population) | $19,708 | $35,092 |
Similar Demographics by Householder Income Ages 45 - 64 years
Demographics Similar to Immigrants from Poland by Householder Income Ages 45 - 64 years
In terms of householder income ages 45 - 64 years, the demographic groups most similar to Immigrants from Poland are Immigrants from Kuwait ($106,285, a difference of 0.030%), European ($106,367, a difference of 0.050%), British ($106,264, a difference of 0.050%), Swedish ($106,377, a difference of 0.060%), and Albanian ($106,243, a difference of 0.070%).
| Demographics | Rating | Rank | Householder Income Ages 45 - 64 years |
| Immigrants | Fiji | 96.5 /100 | #107 | Exceptional $106,952 |
| Zimbabweans | 96.3 /100 | #108 | Exceptional $106,849 |
| Chileans | 95.9 /100 | #109 | Exceptional $106,611 |
| Immigrants | Brazil | 95.6 /100 | #110 | Exceptional $106,470 |
| Immigrants | Vietnam | 95.5 /100 | #111 | Exceptional $106,417 |
| Swedes | 95.4 /100 | #112 | Exceptional $106,377 |
| Europeans | 95.4 /100 | #113 | Exceptional $106,367 |
| Immigrants | Poland | 95.3 /100 | #114 | Exceptional $106,319 |
| Immigrants | Kuwait | 95.2 /100 | #115 | Exceptional $106,285 |
| British | 95.2 /100 | #116 | Exceptional $106,264 |
| Albanians | 95.1 /100 | #117 | Exceptional $106,243 |
| Immigrants | Western Asia | 95.0 /100 | #118 | Exceptional $106,217 |
| Immigrants | Jordan | 94.9 /100 | #119 | Exceptional $106,164 |
| Immigrants | South Eastern Asia | 94.8 /100 | #120 | Exceptional $106,109 |
| Poles | 94.4 /100 | #121 | Exceptional $105,952 |
Demographics Similar to Asians by Householder Income Ages 45 - 64 years
In terms of householder income ages 45 - 64 years, the demographic groups most similar to Asians are Immigrants from Japan ($118,498, a difference of 0.060%), Immigrants from Sweden ($118,318, a difference of 0.090%), Bolivian ($118,871, a difference of 0.38%), Immigrants from Northern Europe ($117,930, a difference of 0.42%), and Immigrants from Belgium ($118,932, a difference of 0.43%).
| Demographics | Rating | Rank | Householder Income Ages 45 - 64 years |
| Immigrants | Korea | 100.0 /100 | #18 | Exceptional $121,243 |
| Eastern Europeans | 100.0 /100 | #19 | Exceptional $120,684 |
| Immigrants | Australia | 100.0 /100 | #20 | Exceptional $119,308 |
| Immigrants | Sri Lanka | 100.0 /100 | #21 | Exceptional $119,094 |
| Immigrants | Belgium | 100.0 /100 | #22 | Exceptional $118,932 |
| Bolivians | 100.0 /100 | #23 | Exceptional $118,871 |
| Immigrants | Japan | 100.0 /100 | #24 | Exceptional $118,498 |
| Asians | 100.0 /100 | #25 | Exceptional $118,426 |
| Immigrants | Sweden | 100.0 /100 | #26 | Exceptional $118,318 |
| Immigrants | Northern Europe | 100.0 /100 | #27 | Exceptional $117,930 |
| Turks | 100.0 /100 | #28 | Exceptional $117,814 |
| Bhutanese | 100.0 /100 | #29 | Exceptional $117,750 |
| Immigrants | Bolivia | 100.0 /100 | #30 | Exceptional $117,731 |
| Immigrants | Asia | 100.0 /100 | #31 | Exceptional $116,566 |
| Russians | 100.0 /100 | #32 | Exceptional $116,328 |