South African vs Albanian Householder Income Ages 45 - 64 years
COMPARE
South African
Albanian
Householder Income Ages 45 - 64 years
Householder Income Ages 45 - 64 years Comparison
South Africans
Albanians
$109,719
HOUSEHOLDER INCOME AGES 45 - 64 YEARS
99.1/ 100
METRIC RATING
75th/ 347
METRIC RANK
$106,243
HOUSEHOLDER INCOME AGES 45 - 64 YEARS
95.1/ 100
METRIC RATING
117th/ 347
METRIC RANK
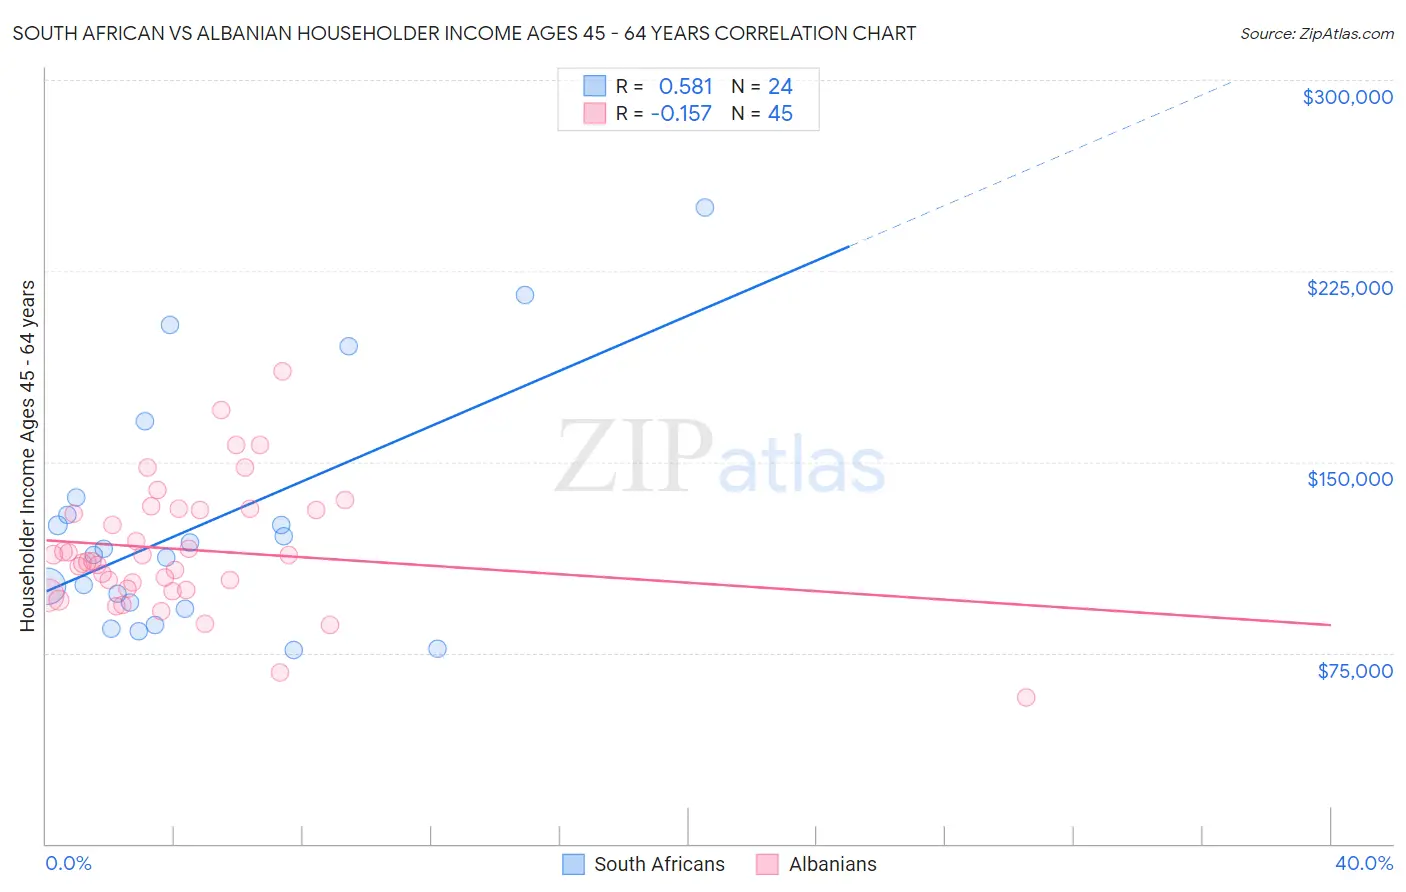
South African vs Albanian Householder Income Ages 45 - 64 years Correlation Chart
The statistical analysis conducted on geographies consisting of 182,453,262 people shows a substantial positive correlation between the proportion of South Africans and household income with householder between the ages 45 and 64 in the United States with a correlation coefficient (R) of 0.581 and weighted average of $109,719. Similarly, the statistical analysis conducted on geographies consisting of 193,108,072 people shows a poor negative correlation between the proportion of Albanians and household income with householder between the ages 45 and 64 in the United States with a correlation coefficient (R) of -0.157 and weighted average of $106,243, a difference of 3.3%.
Householder Income Ages 45 - 64 years Correlation Summary
| Measurement | South African | Albanian |
| Minimum | $76,250 | $57,692 |
| Maximum | $250,001 | $185,625 |
| Range | $173,751 | $127,933 |
| Mean | $125,894 | $115,620 |
| Median | $114,605 | $111,029 |
| Interquartile 25% (IQ1) | $93,424 | $99,857 |
| Interquartile 75% (IQ3) | $132,734 | $131,426 |
| Interquartile Range (IQR) | $39,311 | $31,568 |
| Standard Deviation (Sample) | $46,946 | $24,903 |
| Standard Deviation (Population) | $45,958 | $24,625 |
Similar Demographics by Householder Income Ages 45 - 64 years
Demographics Similar to South Africans by Householder Income Ages 45 - 64 years
In terms of householder income ages 45 - 64 years, the demographic groups most similar to South Africans are Immigrants from Egypt ($109,941, a difference of 0.20%), Paraguayan ($109,447, a difference of 0.25%), Immigrants from England ($109,446, a difference of 0.25%), Immigrants from Canada ($109,402, a difference of 0.29%), and Immigrants from Bulgaria ($109,379, a difference of 0.31%).
| Demographics | Rating | Rank | Householder Income Ages 45 - 64 years |
| Immigrants | Romania | 99.4 /100 | #68 | Exceptional $110,633 |
| Immigrants | Italy | 99.4 /100 | #69 | Exceptional $110,434 |
| Koreans | 99.3 /100 | #70 | Exceptional $110,334 |
| Italians | 99.3 /100 | #71 | Exceptional $110,224 |
| Assyrians/Chaldeans/Syriacs | 99.3 /100 | #72 | Exceptional $110,201 |
| Argentineans | 99.3 /100 | #73 | Exceptional $110,103 |
| Immigrants | Egypt | 99.2 /100 | #74 | Exceptional $109,941 |
| South Africans | 99.1 /100 | #75 | Exceptional $109,719 |
| Paraguayans | 99.0 /100 | #76 | Exceptional $109,447 |
| Immigrants | England | 99.0 /100 | #77 | Exceptional $109,446 |
| Immigrants | Canada | 99.0 /100 | #78 | Exceptional $109,402 |
| Immigrants | Bulgaria | 98.9 /100 | #79 | Exceptional $109,379 |
| Jordanians | 98.9 /100 | #80 | Exceptional $109,376 |
| Immigrants | Eastern Europe | 98.9 /100 | #81 | Exceptional $109,335 |
| Immigrants | North America | 98.8 /100 | #82 | Exceptional $109,198 |
Demographics Similar to Albanians by Householder Income Ages 45 - 64 years
In terms of householder income ages 45 - 64 years, the demographic groups most similar to Albanians are British ($106,264, a difference of 0.020%), Immigrants from Western Asia ($106,217, a difference of 0.020%), Immigrants from Kuwait ($106,285, a difference of 0.040%), Immigrants from Poland ($106,319, a difference of 0.070%), and Immigrants from Jordan ($106,164, a difference of 0.070%).
| Demographics | Rating | Rank | Householder Income Ages 45 - 64 years |
| Immigrants | Brazil | 95.6 /100 | #110 | Exceptional $106,470 |
| Immigrants | Vietnam | 95.5 /100 | #111 | Exceptional $106,417 |
| Swedes | 95.4 /100 | #112 | Exceptional $106,377 |
| Europeans | 95.4 /100 | #113 | Exceptional $106,367 |
| Immigrants | Poland | 95.3 /100 | #114 | Exceptional $106,319 |
| Immigrants | Kuwait | 95.2 /100 | #115 | Exceptional $106,285 |
| British | 95.2 /100 | #116 | Exceptional $106,264 |
| Albanians | 95.1 /100 | #117 | Exceptional $106,243 |
| Immigrants | Western Asia | 95.0 /100 | #118 | Exceptional $106,217 |
| Immigrants | Jordan | 94.9 /100 | #119 | Exceptional $106,164 |
| Immigrants | South Eastern Asia | 94.8 /100 | #120 | Exceptional $106,109 |
| Poles | 94.4 /100 | #121 | Exceptional $105,952 |
| Immigrants | North Macedonia | 94.2 /100 | #122 | Exceptional $105,892 |
| Danes | 93.4 /100 | #123 | Exceptional $105,619 |
| Immigrants | Northern Africa | 92.8 /100 | #124 | Exceptional $105,430 |