Immigrants from Poland vs Albanian 11th Grade
COMPARE
Immigrants from Poland
Albanian
11th Grade
11th Grade Comparison
Immigrants from Poland
Albanians
92.8%
11TH GRADE
78.5/ 100
METRIC RATING
149th/ 347
METRIC RANK
93.0%
11TH GRADE
89.5/ 100
METRIC RATING
130th/ 347
METRIC RANK
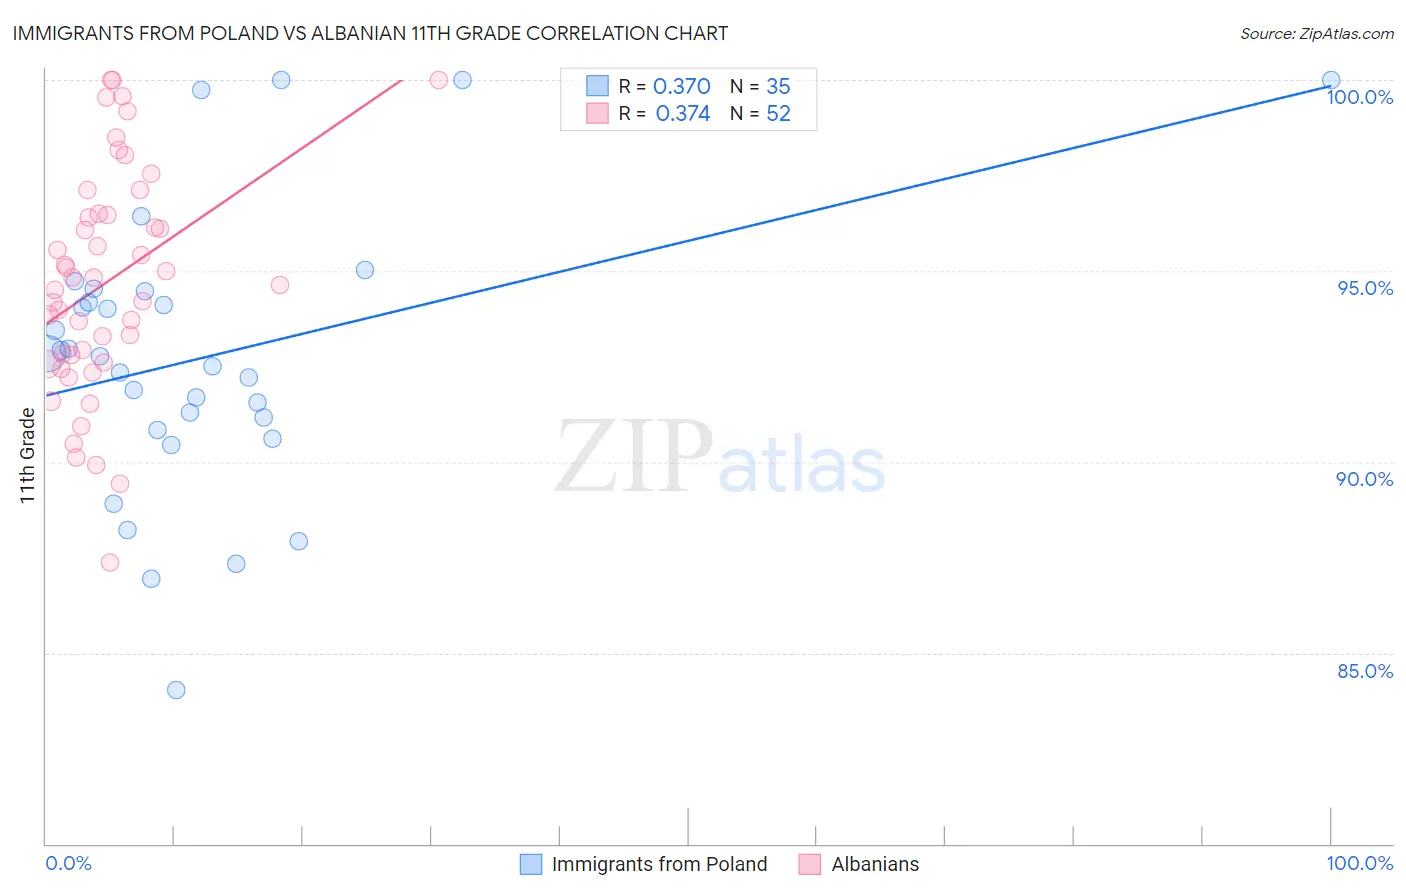
Immigrants from Poland vs Albanian 11th Grade Correlation Chart
The statistical analysis conducted on geographies consisting of 304,861,877 people shows a mild positive correlation between the proportion of Immigrants from Poland and percentage of population with at least 11th grade education in the United States with a correlation coefficient (R) of 0.370 and weighted average of 92.8%. Similarly, the statistical analysis conducted on geographies consisting of 193,265,850 people shows a mild positive correlation between the proportion of Albanians and percentage of population with at least 11th grade education in the United States with a correlation coefficient (R) of 0.374 and weighted average of 93.0%, a difference of 0.21%.
11th Grade Correlation Summary
| Measurement | Immigrants from Poland | Albanian |
| Minimum | 84.0% | 87.4% |
| Maximum | 100.0% | 100.0% |
| Range | 16.0% | 12.6% |
| Mean | 92.7% | 94.7% |
| Median | 92.8% | 94.7% |
| Interquartile 25% (IQ1) | 90.8% | 92.7% |
| Interquartile 75% (IQ3) | 94.5% | 96.5% |
| Interquartile Range (IQR) | 3.6% | 3.8% |
| Standard Deviation (Sample) | 3.7% | 3.0% |
| Standard Deviation (Population) | 3.6% | 2.9% |
Demographics Similar to Immigrants from Poland and Albanians by 11th Grade
In terms of 11th grade, the demographic groups most similar to Immigrants from Poland are Immigrants from Kenya (92.8%, a difference of 0.0%), Hmong (92.8%, a difference of 0.0%), Iroquois (92.8%, a difference of 0.010%), Pakistani (92.8%, a difference of 0.020%), and Assyrian/Chaldean/Syriac (92.8%, a difference of 0.030%). Similarly, the demographic groups most similar to Albanians are Egyptian (93.0%, a difference of 0.0%), Immigrants from Ukraine (93.0%, a difference of 0.010%), Immigrants from Bosnia and Herzegovina (93.0%, a difference of 0.010%), Mongolian (93.0%, a difference of 0.050%), and Delaware (93.0%, a difference of 0.050%).
| Demographics | Rating | Rank | 11th Grade |
| Immigrants | Ukraine | 89.8 /100 | #129 | Excellent 93.0% |
| Albanians | 89.5 /100 | #130 | Excellent 93.0% |
| Egyptians | 89.5 /100 | #131 | Excellent 93.0% |
| Immigrants | Bosnia and Herzegovina | 89.0 /100 | #132 | Excellent 93.0% |
| Mongolians | 87.6 /100 | #133 | Excellent 93.0% |
| Delaware | 87.3 /100 | #134 | Excellent 93.0% |
| Immigrants | Italy | 86.6 /100 | #135 | Excellent 92.9% |
| Cree | 85.9 /100 | #136 | Excellent 92.9% |
| Arabs | 85.4 /100 | #137 | Excellent 92.9% |
| Immigrants | Brazil | 85.1 /100 | #138 | Excellent 92.9% |
| Crow | 84.1 /100 | #139 | Excellent 92.9% |
| Venezuelans | 83.4 /100 | #140 | Excellent 92.9% |
| Chileans | 83.0 /100 | #141 | Excellent 92.9% |
| Kenyans | 82.0 /100 | #142 | Excellent 92.9% |
| Ugandans | 81.4 /100 | #143 | Excellent 92.9% |
| Assyrians/Chaldeans/Syriacs | 80.5 /100 | #144 | Excellent 92.8% |
| Pakistanis | 79.6 /100 | #145 | Good 92.8% |
| Iroquois | 79.1 /100 | #146 | Good 92.8% |
| Immigrants | Kenya | 78.7 /100 | #147 | Good 92.8% |
| Hmong | 78.6 /100 | #148 | Good 92.8% |
| Immigrants | Poland | 78.5 /100 | #149 | Good 92.8% |