Blackfeet vs Albanian Householder Income Ages 45 - 64 years
COMPARE
Blackfeet
Albanian
Householder Income Ages 45 - 64 years
Householder Income Ages 45 - 64 years Comparison
Blackfeet
Albanians
$86,595
HOUSEHOLDER INCOME AGES 45 - 64 YEARS
0.1/ 100
METRIC RATING
285th/ 347
METRIC RANK
$106,243
HOUSEHOLDER INCOME AGES 45 - 64 YEARS
95.1/ 100
METRIC RATING
117th/ 347
METRIC RANK
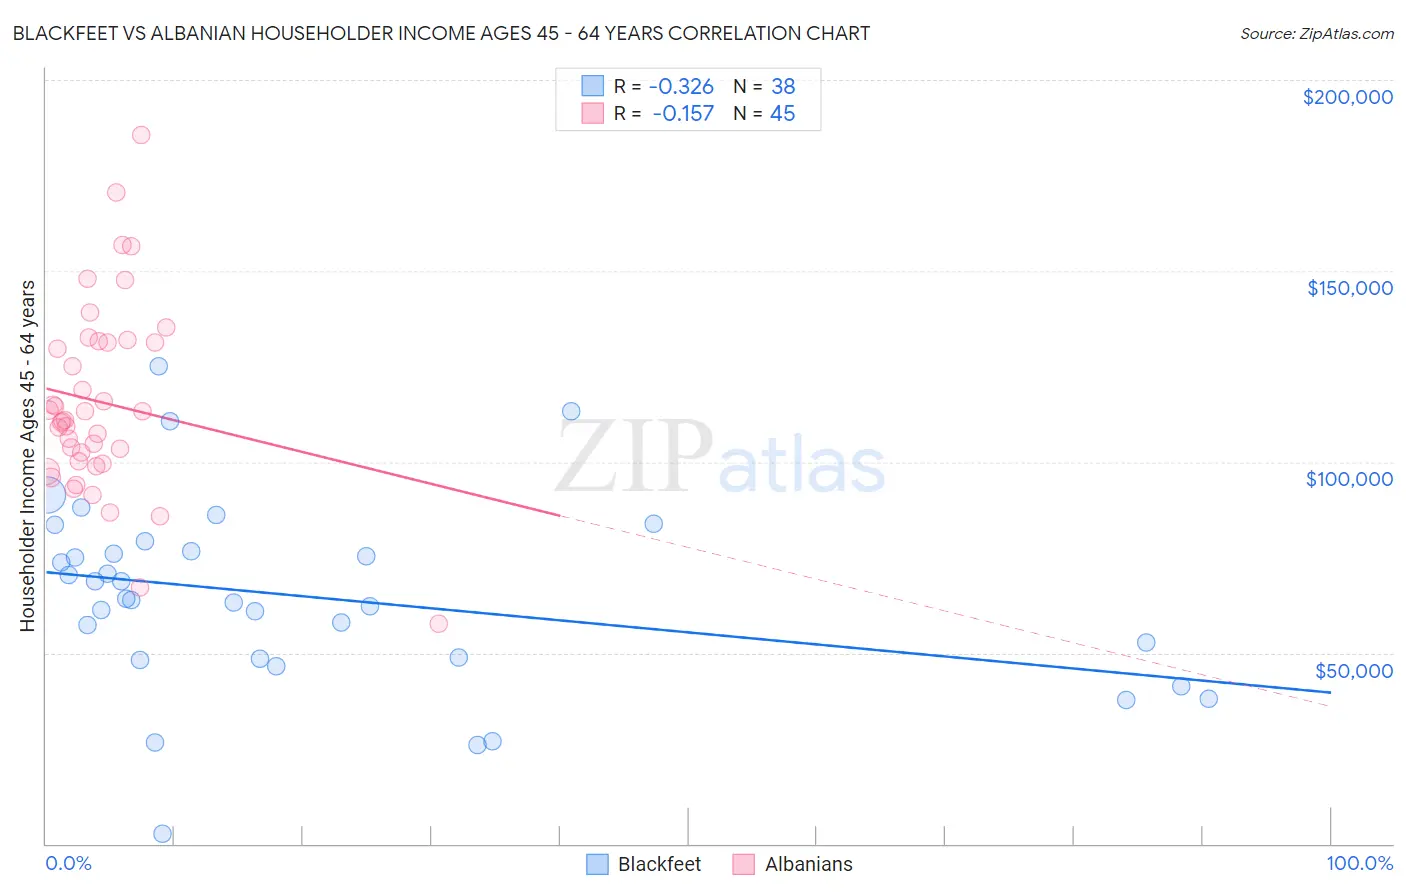
Blackfeet vs Albanian Householder Income Ages 45 - 64 years Correlation Chart
The statistical analysis conducted on geographies consisting of 309,065,778 people shows a mild negative correlation between the proportion of Blackfeet and household income with householder between the ages 45 and 64 in the United States with a correlation coefficient (R) of -0.326 and weighted average of $86,595. Similarly, the statistical analysis conducted on geographies consisting of 193,108,072 people shows a poor negative correlation between the proportion of Albanians and household income with householder between the ages 45 and 64 in the United States with a correlation coefficient (R) of -0.157 and weighted average of $106,243, a difference of 22.7%.
Householder Income Ages 45 - 64 years Correlation Summary
| Measurement | Blackfeet | Albanian |
| Minimum | $2,499 | $57,692 |
| Maximum | $124,961 | $185,625 |
| Range | $122,462 | $127,933 |
| Mean | $64,472 | $115,620 |
| Median | $63,965 | $111,029 |
| Interquartile 25% (IQ1) | $48,500 | $99,857 |
| Interquartile 75% (IQ3) | $76,463 | $131,426 |
| Interquartile Range (IQR) | $27,963 | $31,568 |
| Standard Deviation (Sample) | $24,942 | $24,903 |
| Standard Deviation (Population) | $24,611 | $24,625 |
Similar Demographics by Householder Income Ages 45 - 64 years
Demographics Similar to Blackfeet by Householder Income Ages 45 - 64 years
In terms of householder income ages 45 - 64 years, the demographic groups most similar to Blackfeet are Immigrants from Guatemala ($86,573, a difference of 0.030%), Central American Indian ($86,764, a difference of 0.20%), Bangladeshi ($86,402, a difference of 0.22%), Immigrants from St. Vincent and the Grenadines ($86,394, a difference of 0.23%), and Mexican ($86,816, a difference of 0.25%).
| Demographics | Rating | Rank | Householder Income Ages 45 - 64 years |
| Immigrants | Jamaica | 0.1 /100 | #278 | Tragic $87,035 |
| Yakama | 0.1 /100 | #279 | Tragic $86,992 |
| Immigrants | Somalia | 0.1 /100 | #280 | Tragic $86,987 |
| Yaqui | 0.1 /100 | #281 | Tragic $86,914 |
| Senegalese | 0.1 /100 | #282 | Tragic $86,897 |
| Mexicans | 0.1 /100 | #283 | Tragic $86,816 |
| Central American Indians | 0.1 /100 | #284 | Tragic $86,764 |
| Blackfeet | 0.1 /100 | #285 | Tragic $86,595 |
| Immigrants | Guatemala | 0.1 /100 | #286 | Tragic $86,573 |
| Bangladeshis | 0.1 /100 | #287 | Tragic $86,402 |
| Immigrants | St. Vincent and the Grenadines | 0.1 /100 | #288 | Tragic $86,394 |
| Cubans | 0.1 /100 | #289 | Tragic $86,301 |
| Cherokee | 0.1 /100 | #290 | Tragic $86,125 |
| Hispanics or Latinos | 0.1 /100 | #291 | Tragic $86,006 |
| Immigrants | Central America | 0.1 /100 | #292 | Tragic $85,965 |
Demographics Similar to Albanians by Householder Income Ages 45 - 64 years
In terms of householder income ages 45 - 64 years, the demographic groups most similar to Albanians are British ($106,264, a difference of 0.020%), Immigrants from Western Asia ($106,217, a difference of 0.020%), Immigrants from Kuwait ($106,285, a difference of 0.040%), Immigrants from Poland ($106,319, a difference of 0.070%), and Immigrants from Jordan ($106,164, a difference of 0.070%).
| Demographics | Rating | Rank | Householder Income Ages 45 - 64 years |
| Immigrants | Brazil | 95.6 /100 | #110 | Exceptional $106,470 |
| Immigrants | Vietnam | 95.5 /100 | #111 | Exceptional $106,417 |
| Swedes | 95.4 /100 | #112 | Exceptional $106,377 |
| Europeans | 95.4 /100 | #113 | Exceptional $106,367 |
| Immigrants | Poland | 95.3 /100 | #114 | Exceptional $106,319 |
| Immigrants | Kuwait | 95.2 /100 | #115 | Exceptional $106,285 |
| British | 95.2 /100 | #116 | Exceptional $106,264 |
| Albanians | 95.1 /100 | #117 | Exceptional $106,243 |
| Immigrants | Western Asia | 95.0 /100 | #118 | Exceptional $106,217 |
| Immigrants | Jordan | 94.9 /100 | #119 | Exceptional $106,164 |
| Immigrants | South Eastern Asia | 94.8 /100 | #120 | Exceptional $106,109 |
| Poles | 94.4 /100 | #121 | Exceptional $105,952 |
| Immigrants | North Macedonia | 94.2 /100 | #122 | Exceptional $105,892 |
| Danes | 93.4 /100 | #123 | Exceptional $105,619 |
| Immigrants | Northern Africa | 92.8 /100 | #124 | Exceptional $105,430 |