Immigrants from Panama vs Slovene Householder Income Ages 45 - 64 years
COMPARE
Immigrants from Panama
Slovene
Householder Income Ages 45 - 64 years
Householder Income Ages 45 - 64 years Comparison
Immigrants from Panama
Slovenes
$93,815
HOUSEHOLDER INCOME AGES 45 - 64 YEARS
3.7/ 100
METRIC RATING
228th/ 347
METRIC RANK
$102,885
HOUSEHOLDER INCOME AGES 45 - 64 YEARS
78.3/ 100
METRIC RATING
154th/ 347
METRIC RANK
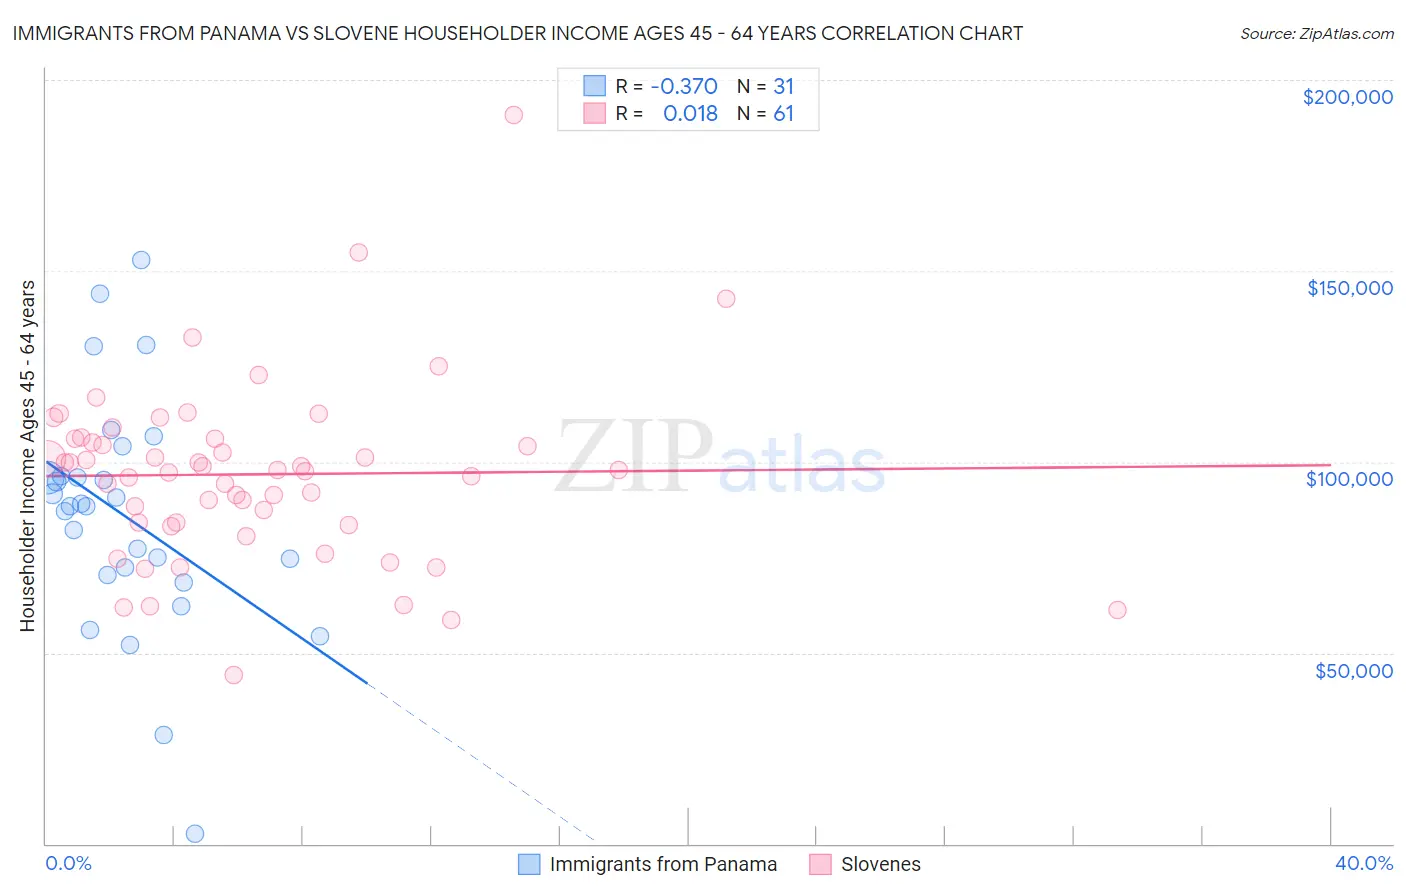
Immigrants from Panama vs Slovene Householder Income Ages 45 - 64 years Correlation Chart
The statistical analysis conducted on geographies consisting of 221,006,827 people shows a mild negative correlation between the proportion of Immigrants from Panama and household income with householder between the ages 45 and 64 in the United States with a correlation coefficient (R) of -0.370 and weighted average of $93,815. Similarly, the statistical analysis conducted on geographies consisting of 261,090,086 people shows no correlation between the proportion of Slovenes and household income with householder between the ages 45 and 64 in the United States with a correlation coefficient (R) of 0.018 and weighted average of $102,885, a difference of 9.7%.
Householder Income Ages 45 - 64 years Correlation Summary
| Measurement | Immigrants from Panama | Slovene |
| Minimum | $2,499 | $44,107 |
| Maximum | $152,844 | $190,938 |
| Range | $150,345 | $146,831 |
| Mean | $86,009 | $96,740 |
| Median | $88,407 | $97,917 |
| Interquartile 25% (IQ1) | $70,337 | $83,761 |
| Interquartile 75% (IQ3) | $96,322 | $106,022 |
| Interquartile Range (IQR) | $25,984 | $22,261 |
| Standard Deviation (Sample) | $30,853 | $23,476 |
| Standard Deviation (Population) | $30,351 | $23,282 |
Similar Demographics by Householder Income Ages 45 - 64 years
Demographics Similar to Immigrants from Panama by Householder Income Ages 45 - 64 years
In terms of householder income ages 45 - 64 years, the demographic groups most similar to Immigrants from Panama are Vietnamese ($93,788, a difference of 0.030%), Immigrants from Sudan ($93,781, a difference of 0.040%), Ecuadorian ($93,739, a difference of 0.080%), Sudanese ($93,718, a difference of 0.10%), and Alaska Native ($93,991, a difference of 0.19%).
| Demographics | Rating | Rank | Householder Income Ages 45 - 64 years |
| Immigrants | Nigeria | 5.9 /100 | #221 | Tragic $94,804 |
| Malaysians | 5.2 /100 | #222 | Tragic $94,517 |
| Immigrants | Nonimmigrants | 5.0 /100 | #223 | Tragic $94,448 |
| Immigrants | Bosnia and Herzegovina | 4.6 /100 | #224 | Tragic $94,288 |
| Bermudans | 4.4 /100 | #225 | Tragic $94,197 |
| Immigrants | Azores | 4.3 /100 | #226 | Tragic $94,138 |
| Alaska Natives | 4.0 /100 | #227 | Tragic $93,991 |
| Immigrants | Panama | 3.7 /100 | #228 | Tragic $93,815 |
| Vietnamese | 3.6 /100 | #229 | Tragic $93,788 |
| Immigrants | Sudan | 3.6 /100 | #230 | Tragic $93,781 |
| Ecuadorians | 3.6 /100 | #231 | Tragic $93,739 |
| Sudanese | 3.5 /100 | #232 | Tragic $93,718 |
| Nepalese | 3.0 /100 | #233 | Tragic $93,355 |
| Immigrants | El Salvador | 2.7 /100 | #234 | Tragic $93,176 |
| Nicaraguans | 2.0 /100 | #235 | Tragic $92,554 |
Demographics Similar to Slovenes by Householder Income Ages 45 - 64 years
In terms of householder income ages 45 - 64 years, the demographic groups most similar to Slovenes are Scandinavian ($102,969, a difference of 0.080%), Costa Rican ($102,779, a difference of 0.10%), Carpatho Rusyn ($102,777, a difference of 0.11%), Immigrants from Ethiopia ($102,763, a difference of 0.12%), and Swiss ($103,071, a difference of 0.18%).
| Demographics | Rating | Rank | Householder Income Ages 45 - 64 years |
| Basques | 82.3 /100 | #147 | Excellent $103,387 |
| Immigrants | Germany | 81.5 /100 | #148 | Excellent $103,282 |
| Immigrants | Sierra Leone | 81.1 /100 | #149 | Excellent $103,227 |
| Immigrants | Peru | 80.7 /100 | #150 | Excellent $103,173 |
| Swiss | 79.9 /100 | #151 | Good $103,071 |
| Irish | 79.8 /100 | #152 | Good $103,067 |
| Scandinavians | 79.0 /100 | #153 | Good $102,969 |
| Slovenes | 78.3 /100 | #154 | Good $102,885 |
| Costa Ricans | 77.4 /100 | #155 | Good $102,779 |
| Carpatho Rusyns | 77.4 /100 | #156 | Good $102,777 |
| Immigrants | Ethiopia | 77.3 /100 | #157 | Good $102,763 |
| Slavs | 76.1 /100 | #158 | Good $102,629 |
| Sierra Leoneans | 74.2 /100 | #159 | Good $102,427 |
| Icelanders | 72.5 /100 | #160 | Good $102,261 |
| Immigrants | Nepal | 71.8 /100 | #161 | Good $102,190 |