Immigrants from Panama vs Israeli Median Household Income
COMPARE
Immigrants from Panama
Israeli
Median Household Income
Median Household Income Comparison
Immigrants from Panama
Israelis
$80,873
MEDIAN HOUSEHOLD INCOME
6.2/ 100
METRIC RATING
226th/ 347
METRIC RANK
$96,552
MEDIAN HOUSEHOLD INCOME
99.9/ 100
METRIC RATING
45th/ 347
METRIC RANK
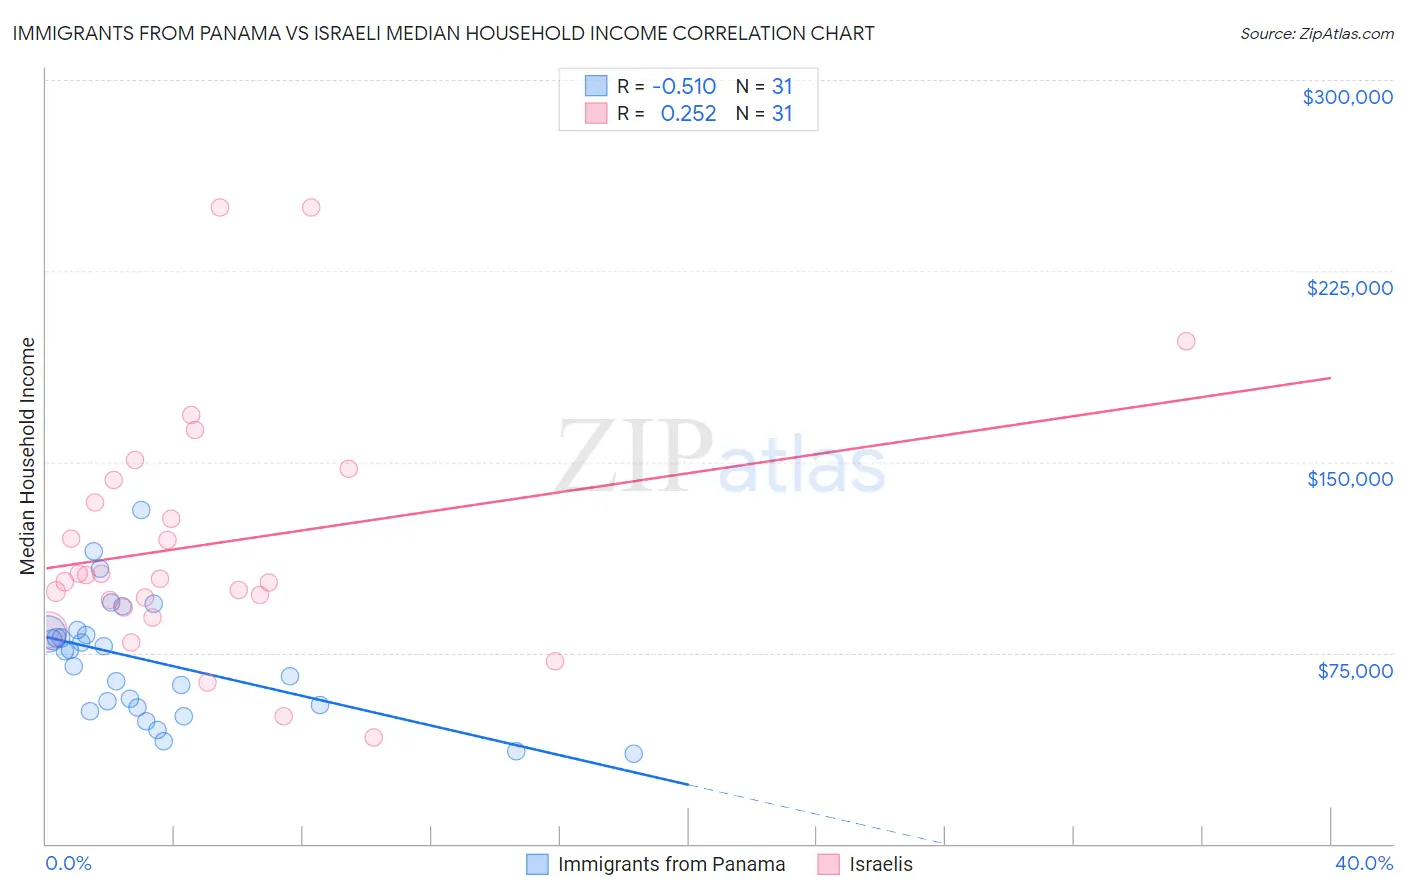
Immigrants from Panama vs Israeli Median Household Income Correlation Chart
The statistical analysis conducted on geographies consisting of 221,141,293 people shows a substantial negative correlation between the proportion of Immigrants from Panama and median household income in the United States with a correlation coefficient (R) of -0.510 and weighted average of $80,873. Similarly, the statistical analysis conducted on geographies consisting of 210,971,551 people shows a weak positive correlation between the proportion of Israelis and median household income in the United States with a correlation coefficient (R) of 0.252 and weighted average of $96,552, a difference of 19.4%.
Median Household Income Correlation Summary
| Measurement | Immigrants from Panama | Israeli |
| Minimum | $35,430 | $41,875 |
| Maximum | $130,979 | $250,001 |
| Range | $95,549 | $208,126 |
| Mean | $71,805 | $117,996 |
| Median | $75,655 | $104,190 |
| Interquartile 25% (IQ1) | $53,712 | $92,986 |
| Interquartile 75% (IQ3) | $82,267 | $142,824 |
| Interquartile Range (IQR) | $28,555 | $49,838 |
| Standard Deviation (Sample) | $23,036 | $48,790 |
| Standard Deviation (Population) | $22,661 | $47,997 |
Similar Demographics by Median Household Income
Demographics Similar to Immigrants from Panama by Median Household Income
In terms of median household income, the demographic groups most similar to Immigrants from Panama are Scotch-Irish ($80,972, a difference of 0.12%), Guyanese ($80,734, a difference of 0.17%), Immigrants from Bangladesh ($80,722, a difference of 0.19%), Malaysian ($81,064, a difference of 0.24%), and Immigrants from El Salvador ($81,213, a difference of 0.42%).
| Demographics | Rating | Rank | Median Household Income |
| Nigerians | 10.3 /100 | #219 | Poor $81,725 |
| Immigrants | Venezuela | 9.0 /100 | #220 | Tragic $81,506 |
| Immigrants | Ghana | 9.0 /100 | #221 | Tragic $81,489 |
| Immigrants | Nigeria | 7.7 /100 | #222 | Tragic $81,236 |
| Immigrants | El Salvador | 7.6 /100 | #223 | Tragic $81,213 |
| Malaysians | 7.0 /100 | #224 | Tragic $81,064 |
| Scotch-Irish | 6.6 /100 | #225 | Tragic $80,972 |
| Immigrants | Panama | 6.2 /100 | #226 | Tragic $80,873 |
| Guyanese | 5.7 /100 | #227 | Tragic $80,734 |
| Immigrants | Bangladesh | 5.7 /100 | #228 | Tragic $80,722 |
| Delaware | 5.0 /100 | #229 | Tragic $80,527 |
| Bermudans | 4.7 /100 | #230 | Tragic $80,406 |
| Trinidadians and Tobagonians | 4.7 /100 | #231 | Tragic $80,402 |
| Immigrants | Trinidad and Tobago | 4.6 /100 | #232 | Tragic $80,373 |
| Immigrants | Azores | 4.5 /100 | #233 | Tragic $80,357 |
Demographics Similar to Israelis by Median Household Income
In terms of median household income, the demographic groups most similar to Israelis are Australian ($96,490, a difference of 0.060%), Immigrants from Greece ($96,675, a difference of 0.13%), Immigrants from Russia ($96,378, a difference of 0.18%), Immigrants from France ($96,743, a difference of 0.20%), and Cambodian ($96,324, a difference of 0.24%).
| Demographics | Rating | Rank | Median Household Income |
| Immigrants | Indonesia | 100.0 /100 | #38 | Exceptional $97,297 |
| Afghans | 100.0 /100 | #39 | Exceptional $97,026 |
| Maltese | 100.0 /100 | #40 | Exceptional $97,015 |
| Immigrants | Turkey | 100.0 /100 | #41 | Exceptional $96,964 |
| Immigrants | Lithuania | 99.9 /100 | #42 | Exceptional $96,836 |
| Immigrants | France | 99.9 /100 | #43 | Exceptional $96,743 |
| Immigrants | Greece | 99.9 /100 | #44 | Exceptional $96,675 |
| Israelis | 99.9 /100 | #45 | Exceptional $96,552 |
| Australians | 99.9 /100 | #46 | Exceptional $96,490 |
| Immigrants | Russia | 99.9 /100 | #47 | Exceptional $96,378 |
| Cambodians | 99.9 /100 | #48 | Exceptional $96,324 |
| Immigrants | Malaysia | 99.9 /100 | #49 | Exceptional $96,292 |
| Bulgarians | 99.9 /100 | #50 | Exceptional $96,290 |
| Estonians | 99.9 /100 | #51 | Exceptional $95,930 |
| Immigrants | South Africa | 99.9 /100 | #52 | Exceptional $95,800 |