Immigrants from Panama vs Venezuelan Median Household Income
COMPARE
Immigrants from Panama
Venezuelan
Median Household Income
Median Household Income Comparison
Immigrants from Panama
Venezuelans
$80,873
MEDIAN HOUSEHOLD INCOME
6.2/ 100
METRIC RATING
226th/ 347
METRIC RANK
$82,432
MEDIAN HOUSEHOLD INCOME
15.3/ 100
METRIC RATING
212th/ 347
METRIC RANK
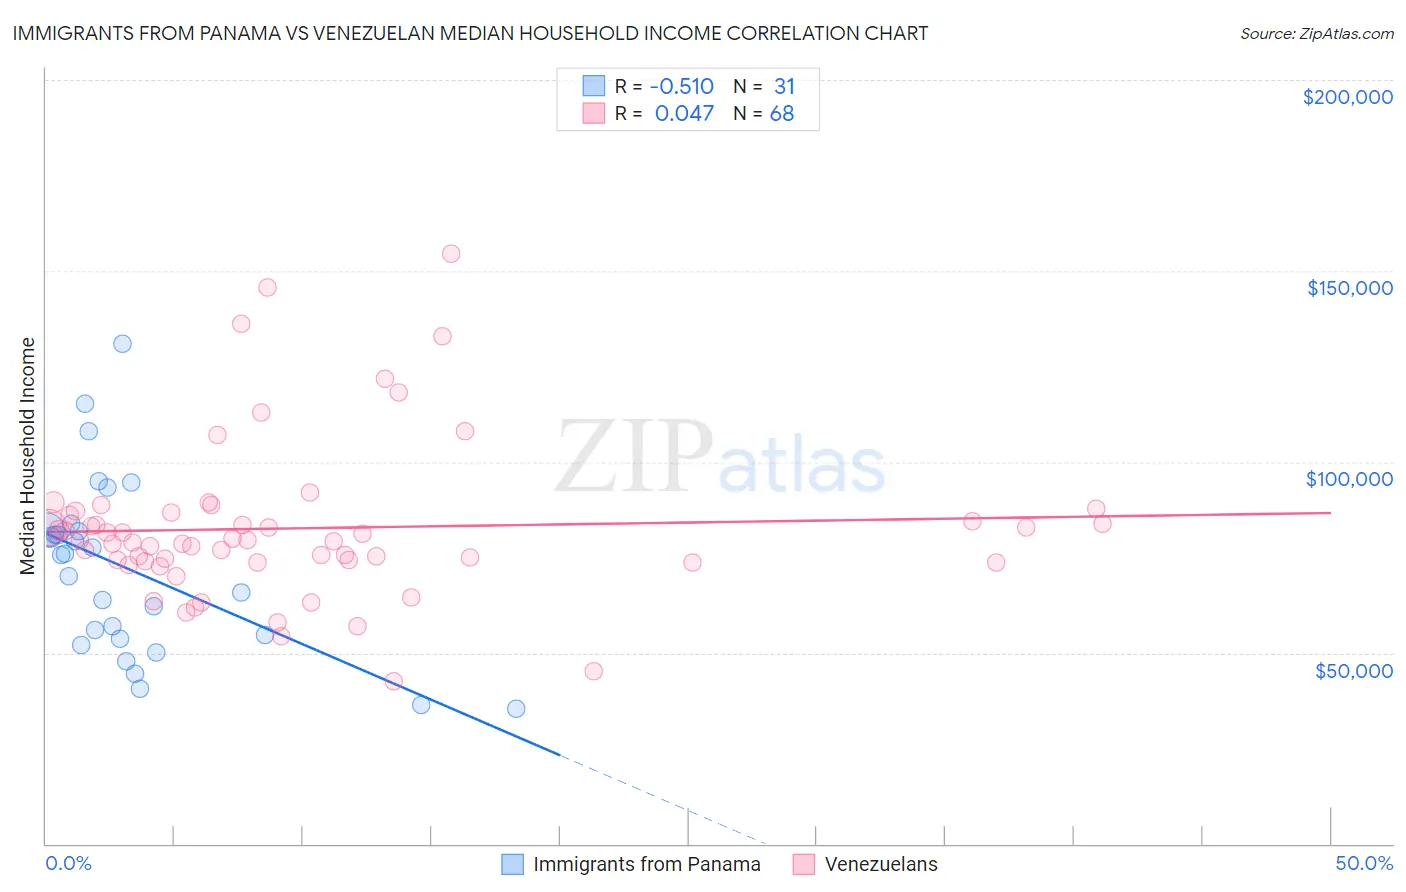
Immigrants from Panama vs Venezuelan Median Household Income Correlation Chart
The statistical analysis conducted on geographies consisting of 221,141,293 people shows a substantial negative correlation between the proportion of Immigrants from Panama and median household income in the United States with a correlation coefficient (R) of -0.510 and weighted average of $80,873. Similarly, the statistical analysis conducted on geographies consisting of 306,067,078 people shows no correlation between the proportion of Venezuelans and median household income in the United States with a correlation coefficient (R) of 0.047 and weighted average of $82,432, a difference of 1.9%.
Median Household Income Correlation Summary
| Measurement | Immigrants from Panama | Venezuelan |
| Minimum | $35,430 | $42,664 |
| Maximum | $130,979 | $154,652 |
| Range | $95,549 | $111,988 |
| Mean | $71,805 | $82,593 |
| Median | $75,655 | $79,442 |
| Interquartile 25% (IQ1) | $53,712 | $73,873 |
| Interquartile 75% (IQ3) | $82,267 | $86,330 |
| Interquartile Range (IQR) | $28,555 | $12,458 |
| Standard Deviation (Sample) | $23,036 | $20,652 |
| Standard Deviation (Population) | $22,661 | $20,500 |
Demographics Similar to Immigrants from Panama and Venezuelans by Median Household Income
In terms of median household income, the demographic groups most similar to Immigrants from Panama are Scotch-Irish ($80,972, a difference of 0.12%), Guyanese ($80,734, a difference of 0.17%), Immigrants from Bangladesh ($80,722, a difference of 0.19%), Malaysian ($81,064, a difference of 0.24%), and Immigrants from El Salvador ($81,213, a difference of 0.42%). Similarly, the demographic groups most similar to Venezuelans are Salvadoran ($82,449, a difference of 0.020%), Nepalese ($82,410, a difference of 0.030%), Immigrants from Uruguay ($82,560, a difference of 0.16%), Immigrants from Iraq ($82,594, a difference of 0.20%), and Panamanian ($82,272, a difference of 0.20%).
| Demographics | Rating | Rank | Median Household Income |
| Immigrants | Iraq | 16.7 /100 | #209 | Poor $82,594 |
| Immigrants | Uruguay | 16.4 /100 | #210 | Poor $82,560 |
| Salvadorans | 15.4 /100 | #211 | Poor $82,449 |
| Venezuelans | 15.3 /100 | #212 | Poor $82,432 |
| Nepalese | 15.1 /100 | #213 | Poor $82,410 |
| Panamanians | 14.0 /100 | #214 | Poor $82,272 |
| Vietnamese | 13.8 /100 | #215 | Poor $82,248 |
| Yugoslavians | 13.3 /100 | #216 | Poor $82,186 |
| Ecuadorians | 12.5 /100 | #217 | Poor $82,070 |
| Whites/Caucasians | 12.2 /100 | #218 | Poor $82,029 |
| Nigerians | 10.3 /100 | #219 | Poor $81,725 |
| Immigrants | Venezuela | 9.0 /100 | #220 | Tragic $81,506 |
| Immigrants | Ghana | 9.0 /100 | #221 | Tragic $81,489 |
| Immigrants | Nigeria | 7.7 /100 | #222 | Tragic $81,236 |
| Immigrants | El Salvador | 7.6 /100 | #223 | Tragic $81,213 |
| Malaysians | 7.0 /100 | #224 | Tragic $81,064 |
| Scotch-Irish | 6.6 /100 | #225 | Tragic $80,972 |
| Immigrants | Panama | 6.2 /100 | #226 | Tragic $80,873 |
| Guyanese | 5.7 /100 | #227 | Tragic $80,734 |
| Immigrants | Bangladesh | 5.7 /100 | #228 | Tragic $80,722 |
| Delaware | 5.0 /100 | #229 | Tragic $80,527 |