Immigrants from Norway vs Bulgarian Median Family Income
COMPARE
Immigrants from Norway
Bulgarian
Median Family Income
Median Family Income Comparison
Immigrants from Norway
Bulgarians
$115,847
MEDIAN FAMILY INCOME
99.9/ 100
METRIC RATING
53rd/ 347
METRIC RANK
$117,818
MEDIAN FAMILY INCOME
100.0/ 100
METRIC RATING
43rd/ 347
METRIC RANK
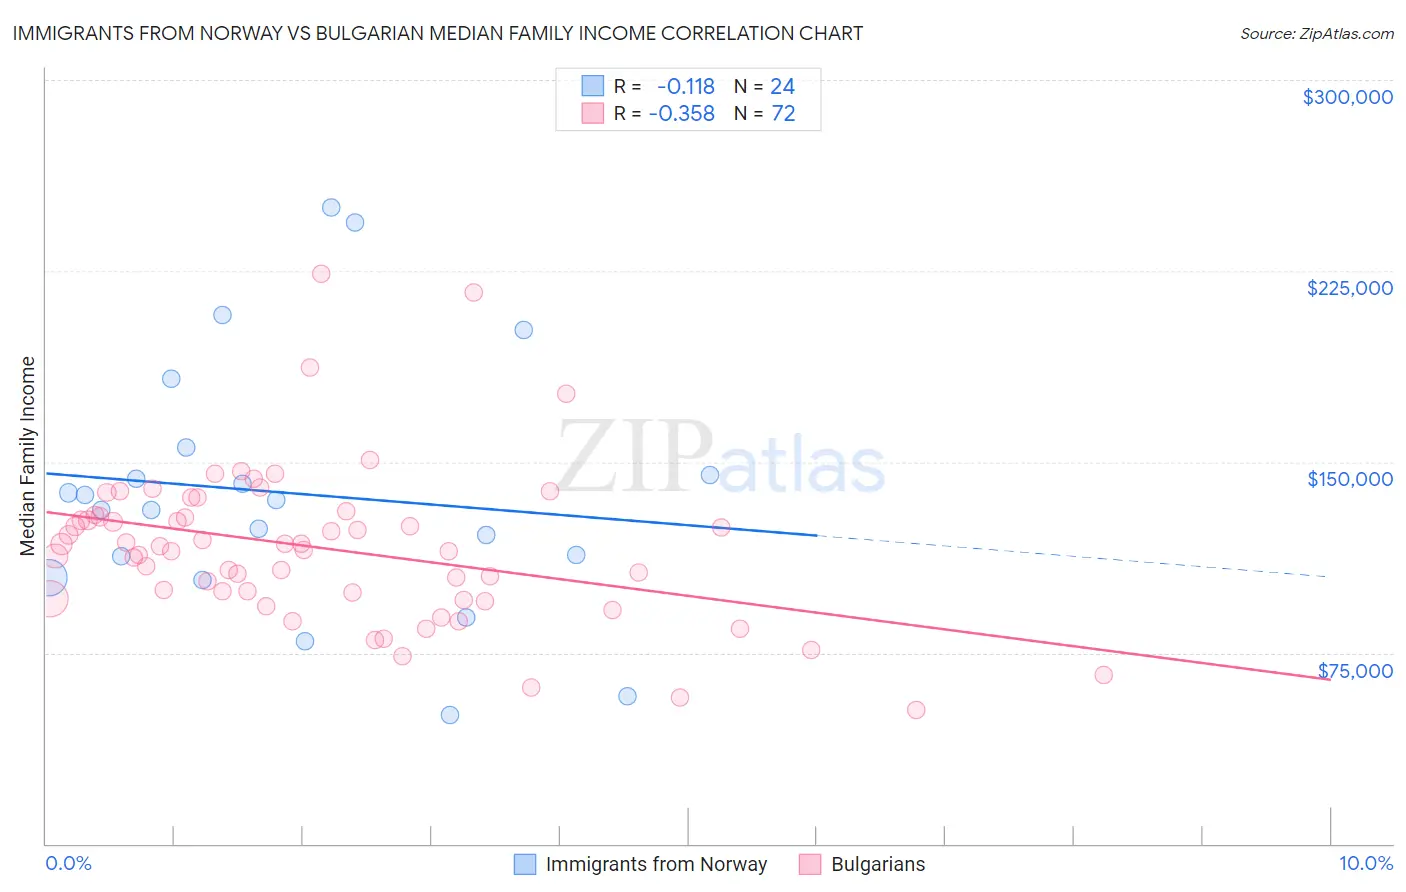
Immigrants from Norway vs Bulgarian Median Family Income Correlation Chart
The statistical analysis conducted on geographies consisting of 116,680,488 people shows a poor negative correlation between the proportion of Immigrants from Norway and median family income in the United States with a correlation coefficient (R) of -0.118 and weighted average of $115,847. Similarly, the statistical analysis conducted on geographies consisting of 205,529,266 people shows a mild negative correlation between the proportion of Bulgarians and median family income in the United States with a correlation coefficient (R) of -0.358 and weighted average of $117,818, a difference of 1.7%.
Median Family Income Correlation Summary
| Measurement | Immigrants from Norway | Bulgarian |
| Minimum | $50,417 | $52,778 |
| Maximum | $250,001 | $223,917 |
| Range | $199,584 | $171,139 |
| Mean | $137,530 | $116,110 |
| Median | $133,287 | $116,274 |
| Interquartile 25% (IQ1) | $108,664 | $97,368 |
| Interquartile 75% (IQ3) | $150,184 | $128,713 |
| Interquartile Range (IQR) | $41,519 | $31,345 |
| Standard Deviation (Sample) | $50,729 | $30,846 |
| Standard Deviation (Population) | $49,661 | $30,631 |
Demographics Similar to Immigrants from Norway and Bulgarians by Median Family Income
In terms of median family income, the demographic groups most similar to Immigrants from Norway are Maltese ($115,862, a difference of 0.010%), Immigrants from Malaysia ($115,880, a difference of 0.030%), Immigrants from Czechoslovakia ($116,165, a difference of 0.27%), Immigrants from Europe ($115,523, a difference of 0.28%), and Chinese ($116,188, a difference of 0.29%). Similarly, the demographic groups most similar to Bulgarians are Cambodian ($117,780, a difference of 0.030%), Immigrants from Bolivia ($117,912, a difference of 0.080%), Estonian ($118,013, a difference of 0.17%), Immigrants from Lithuania ($118,053, a difference of 0.20%), and Immigrants from Asia ($118,291, a difference of 0.40%).
| Demographics | Rating | Rank | Median Family Income |
| Immigrants | Turkey | 100.0 /100 | #38 | Exceptional $118,325 |
| Immigrants | Asia | 100.0 /100 | #39 | Exceptional $118,291 |
| Immigrants | Lithuania | 100.0 /100 | #40 | Exceptional $118,053 |
| Estonians | 100.0 /100 | #41 | Exceptional $118,013 |
| Immigrants | Bolivia | 100.0 /100 | #42 | Exceptional $117,912 |
| Bulgarians | 100.0 /100 | #43 | Exceptional $117,818 |
| Cambodians | 100.0 /100 | #44 | Exceptional $117,780 |
| Immigrants | Greece | 99.9 /100 | #45 | Exceptional $117,344 |
| Immigrants | Russia | 99.9 /100 | #46 | Exceptional $116,942 |
| Immigrants | Austria | 99.9 /100 | #47 | Exceptional $116,830 |
| Immigrants | South Africa | 99.9 /100 | #48 | Exceptional $116,286 |
| Chinese | 99.9 /100 | #49 | Exceptional $116,188 |
| Immigrants | Czechoslovakia | 99.9 /100 | #50 | Exceptional $116,165 |
| Immigrants | Malaysia | 99.9 /100 | #51 | Exceptional $115,880 |
| Maltese | 99.9 /100 | #52 | Exceptional $115,862 |
| Immigrants | Norway | 99.9 /100 | #53 | Exceptional $115,847 |
| Immigrants | Europe | 99.9 /100 | #54 | Exceptional $115,523 |
| Lithuanians | 99.8 /100 | #55 | Exceptional $115,395 |
| New Zealanders | 99.8 /100 | #56 | Exceptional $115,230 |
| Greeks | 99.8 /100 | #57 | Exceptional $115,192 |
| Immigrants | Indonesia | 99.8 /100 | #58 | Exceptional $115,162 |