Alaska Native vs Immigrants from Jordan Median Earnings
COMPARE
Alaska Native
Immigrants from Jordan
Median Earnings
Median Earnings Comparison
Alaska Natives
Immigrants from Jordan
$43,750
MEDIAN EARNINGS
2.3/ 100
METRIC RATING
250th/ 347
METRIC RANK
$48,673
MEDIAN EARNINGS
95.9/ 100
METRIC RATING
118th/ 347
METRIC RANK
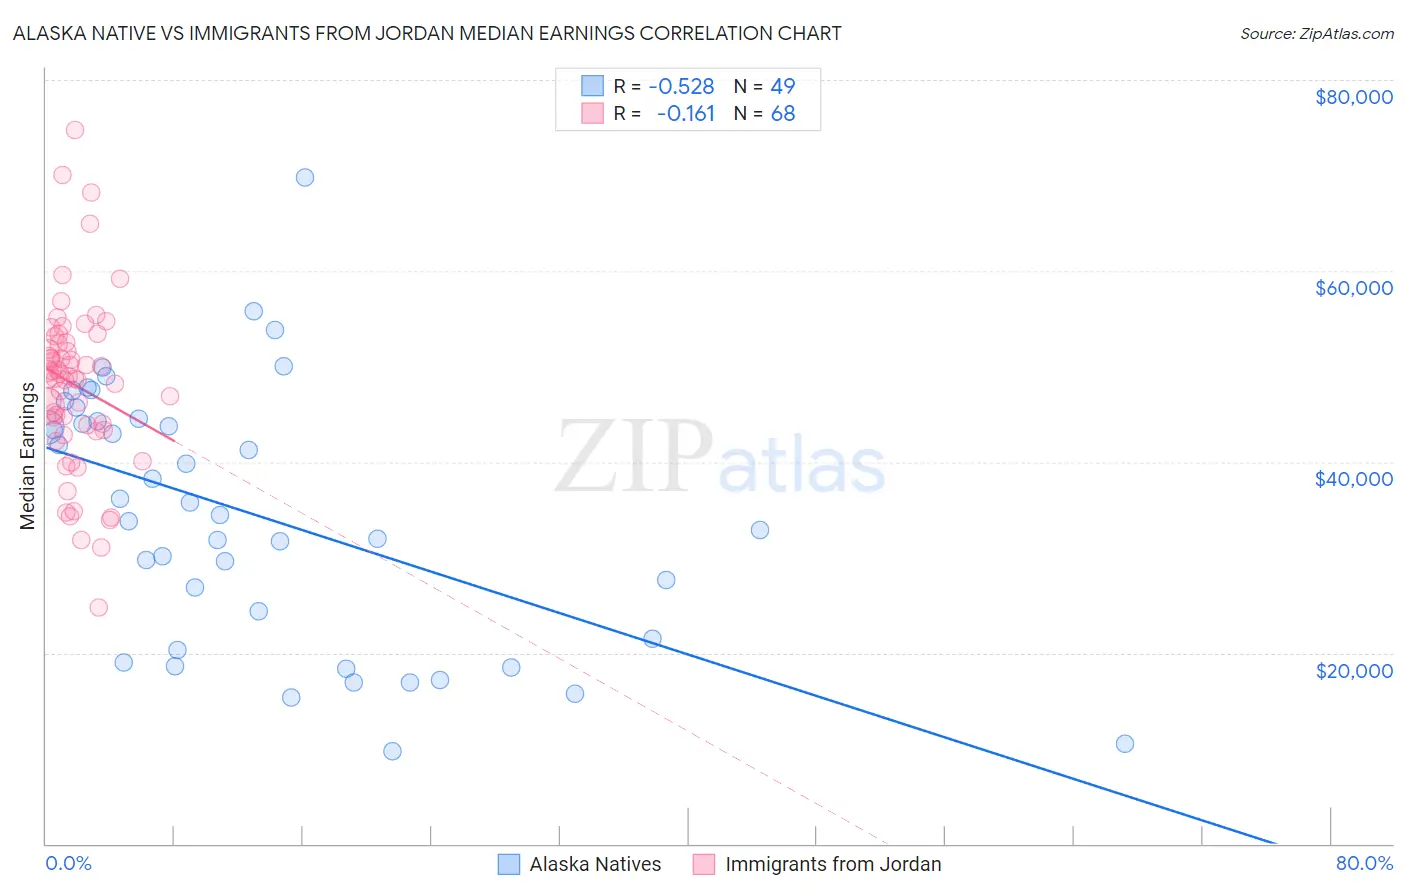
Alaska Native vs Immigrants from Jordan Median Earnings Correlation Chart
The statistical analysis conducted on geographies consisting of 76,766,332 people shows a substantial negative correlation between the proportion of Alaska Natives and median earnings in the United States with a correlation coefficient (R) of -0.528 and weighted average of $43,750. Similarly, the statistical analysis conducted on geographies consisting of 181,245,350 people shows a poor negative correlation between the proportion of Immigrants from Jordan and median earnings in the United States with a correlation coefficient (R) of -0.161 and weighted average of $48,673, a difference of 11.3%.
Median Earnings Correlation Summary
| Measurement | Alaska Native | Immigrants from Jordan |
| Minimum | $9,662 | $24,779 |
| Maximum | $69,808 | $74,707 |
| Range | $60,146 | $49,928 |
| Mean | $34,396 | $48,083 |
| Median | $34,412 | $48,848 |
| Interquartile 25% (IQ1) | $20,906 | $43,626 |
| Interquartile 75% (IQ3) | $44,339 | $52,401 |
| Interquartile Range (IQR) | $23,432 | $8,775 |
| Standard Deviation (Sample) | $13,540 | $8,922 |
| Standard Deviation (Population) | $13,401 | $8,857 |
Similar Demographics by Median Earnings
Demographics Similar to Alaska Natives by Median Earnings
In terms of median earnings, the demographic groups most similar to Alaska Natives are Tsimshian ($43,695, a difference of 0.13%), Hawaiian ($43,673, a difference of 0.18%), Malaysian ($43,844, a difference of 0.22%), Nepalese ($43,860, a difference of 0.25%), and Somali ($43,567, a difference of 0.42%).
| Demographics | Rating | Rank | Median Earnings |
| Sub-Saharan Africans | 3.7 /100 | #243 | Tragic $44,118 |
| Immigrants | Nonimmigrants | 3.7 /100 | #244 | Tragic $44,117 |
| Immigrants | Burma/Myanmar | 3.2 /100 | #245 | Tragic $43,998 |
| Immigrants | West Indies | 3.1 /100 | #246 | Tragic $43,989 |
| Immigrants | Cabo Verde | 3.0 /100 | #247 | Tragic $43,963 |
| Nepalese | 2.6 /100 | #248 | Tragic $43,860 |
| Malaysians | 2.6 /100 | #249 | Tragic $43,844 |
| Alaska Natives | 2.3 /100 | #250 | Tragic $43,750 |
| Tsimshian | 2.1 /100 | #251 | Tragic $43,695 |
| Hawaiians | 2.0 /100 | #252 | Tragic $43,673 |
| Somalis | 1.8 /100 | #253 | Tragic $43,567 |
| Liberians | 1.7 /100 | #254 | Tragic $43,536 |
| Immigrants | Middle Africa | 1.4 /100 | #255 | Tragic $43,416 |
| Alaskan Athabascans | 1.4 /100 | #256 | Tragic $43,393 |
| Jamaicans | 1.3 /100 | #257 | Tragic $43,343 |
Demographics Similar to Immigrants from Jordan by Median Earnings
In terms of median earnings, the demographic groups most similar to Immigrants from Jordan are Serbian ($48,677, a difference of 0.010%), Polish ($48,659, a difference of 0.030%), Korean ($48,727, a difference of 0.11%), Carpatho Rusyn ($48,617, a difference of 0.11%), and Arab ($48,599, a difference of 0.15%).
| Demographics | Rating | Rank | Median Earnings |
| Immigrants | Zimbabwe | 97.0 /100 | #111 | Exceptional $48,913 |
| Northern Europeans | 96.9 /100 | #112 | Exceptional $48,887 |
| Immigrants | Kuwait | 96.8 /100 | #113 | Exceptional $48,861 |
| Moroccans | 96.7 /100 | #114 | Exceptional $48,838 |
| Chinese | 96.7 /100 | #115 | Exceptional $48,836 |
| Koreans | 96.2 /100 | #116 | Exceptional $48,727 |
| Serbians | 95.9 /100 | #117 | Exceptional $48,677 |
| Immigrants | Jordan | 95.9 /100 | #118 | Exceptional $48,673 |
| Poles | 95.8 /100 | #119 | Exceptional $48,659 |
| Carpatho Rusyns | 95.5 /100 | #120 | Exceptional $48,617 |
| Arabs | 95.4 /100 | #121 | Exceptional $48,599 |
| Chileans | 94.8 /100 | #122 | Exceptional $48,504 |
| Immigrants | Syria | 93.9 /100 | #123 | Exceptional $48,375 |
| Brazilians | 93.7 /100 | #124 | Exceptional $48,356 |
| Immigrants | Fiji | 93.3 /100 | #125 | Exceptional $48,305 |