Immigrants from North Macedonia vs Central American Indian Per Capita Income
COMPARE
Immigrants from North Macedonia
Central American Indian
Per Capita Income
Per Capita Income Comparison
Immigrants from North Macedonia
Central American Indians
$45,622
PER CAPITA INCOME
90.0/ 100
METRIC RATING
131st/ 347
METRIC RANK
$37,699
PER CAPITA INCOME
0.1/ 100
METRIC RATING
286th/ 347
METRIC RANK
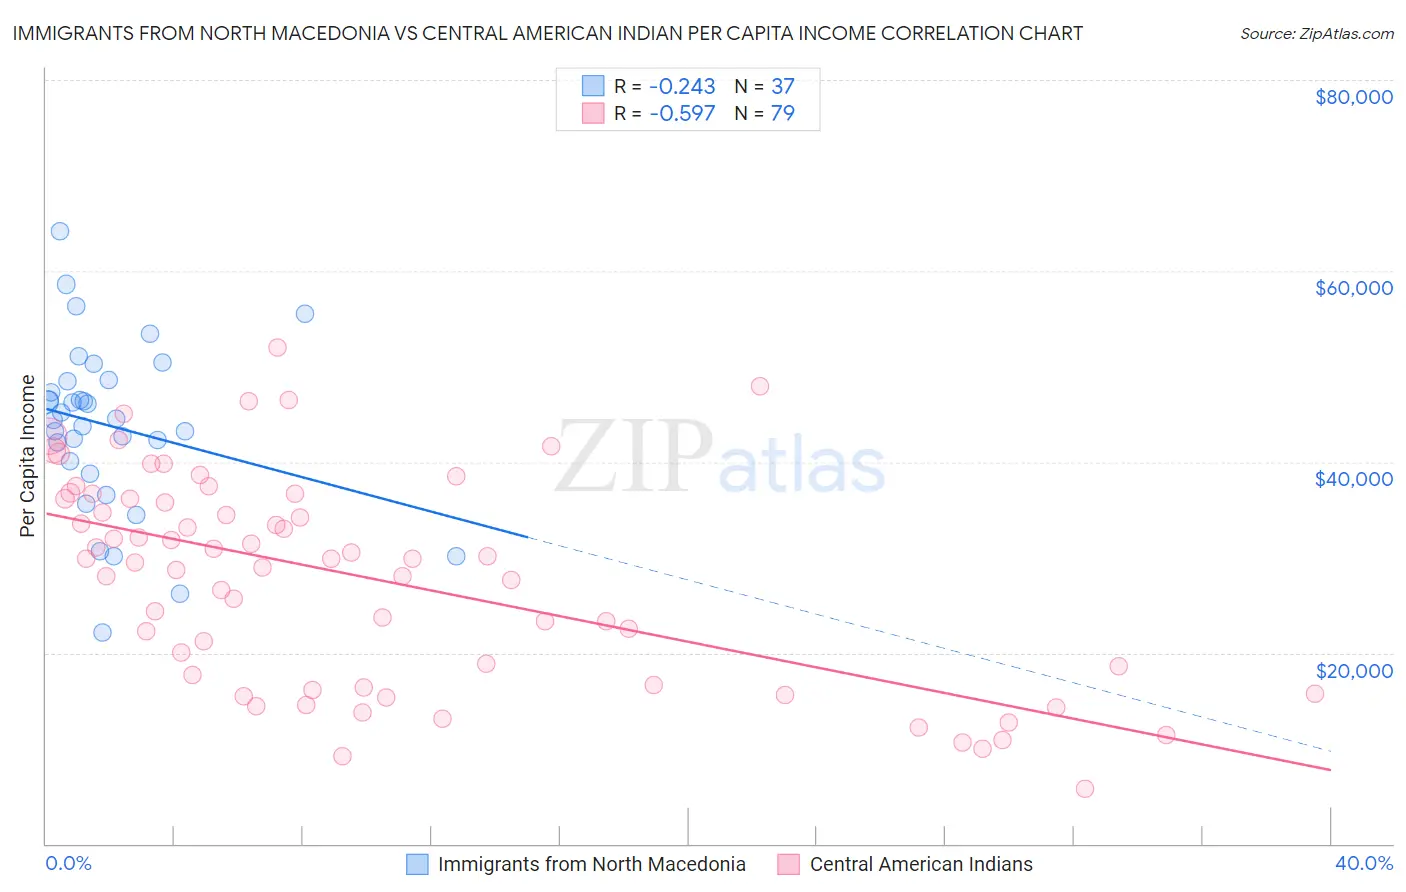
Immigrants from North Macedonia vs Central American Indian Per Capita Income Correlation Chart
The statistical analysis conducted on geographies consisting of 74,060,501 people shows a weak negative correlation between the proportion of Immigrants from North Macedonia and per capita income in the United States with a correlation coefficient (R) of -0.243 and weighted average of $45,622. Similarly, the statistical analysis conducted on geographies consisting of 326,146,034 people shows a substantial negative correlation between the proportion of Central American Indians and per capita income in the United States with a correlation coefficient (R) of -0.597 and weighted average of $37,699, a difference of 21.0%.
Per Capita Income Correlation Summary
| Measurement | Immigrants from North Macedonia | Central American Indian |
| Minimum | $22,118 | $5,814 |
| Maximum | $64,214 | $51,916 |
| Range | $42,096 | $46,102 |
| Mean | $43,782 | $27,773 |
| Median | $44,497 | $29,805 |
| Interquartile 25% (IQ1) | $39,397 | $16,640 |
| Interquartile 75% (IQ3) | $48,508 | $36,169 |
| Interquartile Range (IQR) | $9,111 | $19,529 |
| Standard Deviation (Sample) | $8,887 | $10,964 |
| Standard Deviation (Population) | $8,766 | $10,894 |
Similar Demographics by Per Capita Income
Demographics Similar to Immigrants from North Macedonia by Per Capita Income
In terms of per capita income, the demographic groups most similar to Immigrants from North Macedonia are Jordanian ($45,605, a difference of 0.040%), Pakistani ($45,587, a difference of 0.080%), Luxembourger ($45,663, a difference of 0.090%), Arab ($45,662, a difference of 0.090%), and Slovene ($45,581, a difference of 0.090%).
| Demographics | Rating | Rank | Per Capita Income |
| Europeans | 92.0 /100 | #124 | Exceptional $45,836 |
| Zimbabweans | 91.7 /100 | #125 | Exceptional $45,804 |
| Palestinians | 91.6 /100 | #126 | Exceptional $45,790 |
| Immigrants | Germany | 91.3 /100 | #127 | Exceptional $45,751 |
| Swedes | 91.3 /100 | #128 | Exceptional $45,750 |
| Luxembourgers | 90.4 /100 | #129 | Exceptional $45,663 |
| Arabs | 90.4 /100 | #130 | Exceptional $45,662 |
| Immigrants | North Macedonia | 90.0 /100 | #131 | Exceptional $45,622 |
| Jordanians | 89.9 /100 | #132 | Excellent $45,605 |
| Pakistanis | 89.7 /100 | #133 | Excellent $45,587 |
| Slovenes | 89.6 /100 | #134 | Excellent $45,581 |
| Hungarians | 87.9 /100 | #135 | Excellent $45,426 |
| Immigrants | Oceania | 85.2 /100 | #136 | Excellent $45,220 |
| Immigrants | Syria | 85.2 /100 | #137 | Excellent $45,218 |
| Assyrians/Chaldeans/Syriacs | 84.8 /100 | #138 | Excellent $45,195 |
Demographics Similar to Central American Indians by Per Capita Income
In terms of per capita income, the demographic groups most similar to Central American Indians are Dominican ($37,697, a difference of 0.010%), Blackfeet ($37,695, a difference of 0.010%), Guatemalan ($37,766, a difference of 0.18%), African ($37,785, a difference of 0.23%), and U.S. Virgin Islander ($37,589, a difference of 0.29%).
| Demographics | Rating | Rank | Per Capita Income |
| Colville | 0.2 /100 | #279 | Tragic $38,047 |
| Potawatomi | 0.2 /100 | #280 | Tragic $38,046 |
| Immigrants | Dominica | 0.2 /100 | #281 | Tragic $37,952 |
| Immigrants | Laos | 0.1 /100 | #282 | Tragic $37,857 |
| Pennsylvania Germans | 0.1 /100 | #283 | Tragic $37,842 |
| Africans | 0.1 /100 | #284 | Tragic $37,785 |
| Guatemalans | 0.1 /100 | #285 | Tragic $37,766 |
| Central American Indians | 0.1 /100 | #286 | Tragic $37,699 |
| Dominicans | 0.1 /100 | #287 | Tragic $37,697 |
| Blackfeet | 0.1 /100 | #288 | Tragic $37,695 |
| U.S. Virgin Islanders | 0.1 /100 | #289 | Tragic $37,589 |
| Immigrants | Guatemala | 0.1 /100 | #290 | Tragic $37,550 |
| Cajuns | 0.1 /100 | #291 | Tragic $37,527 |
| Immigrants | Micronesia | 0.1 /100 | #292 | Tragic $37,464 |
| Mexican American Indians | 0.1 /100 | #293 | Tragic $37,407 |