Immigrants from North Macedonia vs Taiwanese Per Capita Income
COMPARE
Immigrants from North Macedonia
Taiwanese
Per Capita Income
Per Capita Income Comparison
Immigrants from North Macedonia
Taiwanese
$45,622
PER CAPITA INCOME
90.0/ 100
METRIC RATING
131st/ 347
METRIC RANK
$46,455
PER CAPITA INCOME
95.8/ 100
METRIC RATING
111th/ 347
METRIC RANK
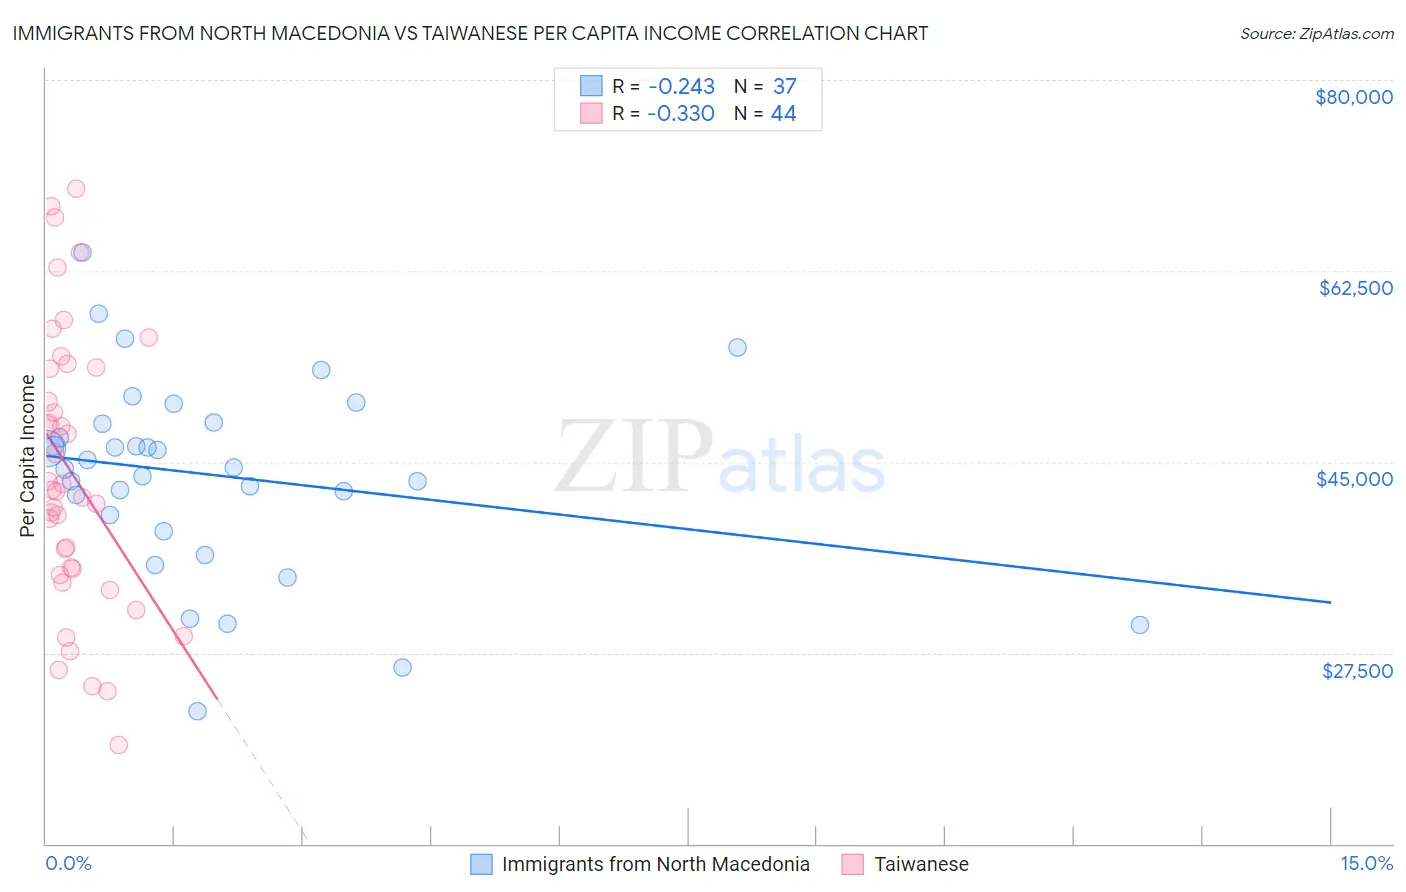
Immigrants from North Macedonia vs Taiwanese Per Capita Income Correlation Chart
The statistical analysis conducted on geographies consisting of 74,060,501 people shows a weak negative correlation between the proportion of Immigrants from North Macedonia and per capita income in the United States with a correlation coefficient (R) of -0.243 and weighted average of $45,622. Similarly, the statistical analysis conducted on geographies consisting of 31,724,936 people shows a mild negative correlation between the proportion of Taiwanese and per capita income in the United States with a correlation coefficient (R) of -0.330 and weighted average of $46,455, a difference of 1.8%.
Per Capita Income Correlation Summary
| Measurement | Immigrants from North Macedonia | Taiwanese |
| Minimum | $22,118 | $19,108 |
| Maximum | $64,214 | $70,046 |
| Range | $42,096 | $50,938 |
| Mean | $43,782 | $43,880 |
| Median | $44,497 | $42,360 |
| Interquartile 25% (IQ1) | $39,397 | $34,944 |
| Interquartile 75% (IQ3) | $48,508 | $53,629 |
| Interquartile Range (IQR) | $9,111 | $18,684 |
| Standard Deviation (Sample) | $8,887 | $12,658 |
| Standard Deviation (Population) | $8,766 | $12,514 |
Demographics Similar to Immigrants from North Macedonia and Taiwanese by Per Capita Income
In terms of per capita income, the demographic groups most similar to Immigrants from North Macedonia are Luxembourger ($45,663, a difference of 0.090%), Arab ($45,662, a difference of 0.090%), Immigrants from Germany ($45,751, a difference of 0.28%), Swedish ($45,750, a difference of 0.28%), and Palestinian ($45,790, a difference of 0.37%). Similarly, the demographic groups most similar to Taiwanese are Immigrants from Morocco ($46,430, a difference of 0.050%), Immigrants from Albania ($46,387, a difference of 0.14%), Afghan ($46,268, a difference of 0.40%), Immigrants from Chile ($46,213, a difference of 0.52%), and Polish ($46,123, a difference of 0.72%).
| Demographics | Rating | Rank | Per Capita Income |
| Taiwanese | 95.8 /100 | #111 | Exceptional $46,455 |
| Immigrants | Morocco | 95.7 /100 | #112 | Exceptional $46,430 |
| Immigrants | Albania | 95.5 /100 | #113 | Exceptional $46,387 |
| Afghans | 94.9 /100 | #114 | Exceptional $46,268 |
| Immigrants | Chile | 94.6 /100 | #115 | Exceptional $46,213 |
| Poles | 94.1 /100 | #116 | Exceptional $46,123 |
| Chinese | 93.9 /100 | #117 | Exceptional $46,098 |
| Immigrants | Saudi Arabia | 93.3 /100 | #118 | Exceptional $46,008 |
| Immigrants | Poland | 93.1 /100 | #119 | Exceptional $45,979 |
| Immigrants | Ethiopia | 92.7 /100 | #120 | Exceptional $45,923 |
| Canadians | 92.2 /100 | #121 | Exceptional $45,858 |
| Moroccans | 92.1 /100 | #122 | Exceptional $45,854 |
| Lebanese | 92.0 /100 | #123 | Exceptional $45,840 |
| Europeans | 92.0 /100 | #124 | Exceptional $45,836 |
| Zimbabweans | 91.7 /100 | #125 | Exceptional $45,804 |
| Palestinians | 91.6 /100 | #126 | Exceptional $45,790 |
| Immigrants | Germany | 91.3 /100 | #127 | Exceptional $45,751 |
| Swedes | 91.3 /100 | #128 | Exceptional $45,750 |
| Luxembourgers | 90.4 /100 | #129 | Exceptional $45,663 |
| Arabs | 90.4 /100 | #130 | Exceptional $45,662 |
| Immigrants | North Macedonia | 90.0 /100 | #131 | Exceptional $45,622 |