Immigrants from North Macedonia vs Immigrants from Iraq Per Capita Income
COMPARE
Immigrants from North Macedonia
Immigrants from Iraq
Per Capita Income
Per Capita Income Comparison
Immigrants from North Macedonia
Immigrants from Iraq
$45,622
PER CAPITA INCOME
90.0/ 100
METRIC RATING
131st/ 347
METRIC RANK
$41,365
PER CAPITA INCOME
7.1/ 100
METRIC RATING
222nd/ 347
METRIC RANK
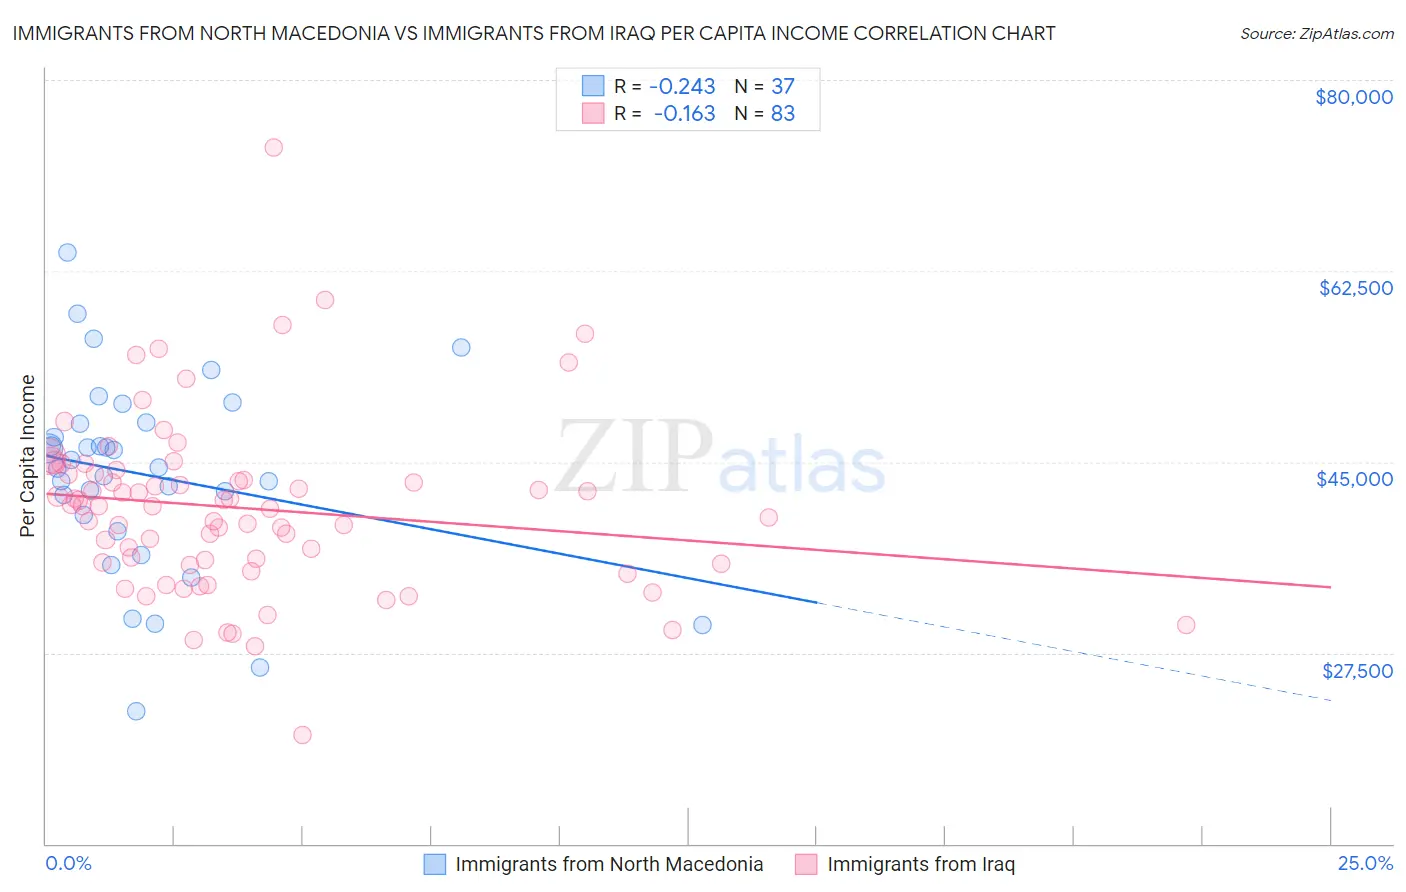
Immigrants from North Macedonia vs Immigrants from Iraq Per Capita Income Correlation Chart
The statistical analysis conducted on geographies consisting of 74,060,501 people shows a weak negative correlation between the proportion of Immigrants from North Macedonia and per capita income in the United States with a correlation coefficient (R) of -0.243 and weighted average of $45,622. Similarly, the statistical analysis conducted on geographies consisting of 194,781,264 people shows a poor negative correlation between the proportion of Immigrants from Iraq and per capita income in the United States with a correlation coefficient (R) of -0.163 and weighted average of $41,365, a difference of 10.3%.
Per Capita Income Correlation Summary
| Measurement | Immigrants from North Macedonia | Immigrants from Iraq |
| Minimum | $22,118 | $19,973 |
| Maximum | $64,214 | $73,810 |
| Range | $42,096 | $53,837 |
| Mean | $43,782 | $40,767 |
| Median | $44,497 | $40,988 |
| Interquartile 25% (IQ1) | $39,397 | $35,615 |
| Interquartile 75% (IQ3) | $48,508 | $43,922 |
| Interquartile Range (IQR) | $9,111 | $8,307 |
| Standard Deviation (Sample) | $8,887 | $8,068 |
| Standard Deviation (Population) | $8,766 | $8,019 |
Similar Demographics by Per Capita Income
Demographics Similar to Immigrants from North Macedonia by Per Capita Income
In terms of per capita income, the demographic groups most similar to Immigrants from North Macedonia are Jordanian ($45,605, a difference of 0.040%), Pakistani ($45,587, a difference of 0.080%), Luxembourger ($45,663, a difference of 0.090%), Arab ($45,662, a difference of 0.090%), and Slovene ($45,581, a difference of 0.090%).
| Demographics | Rating | Rank | Per Capita Income |
| Europeans | 92.0 /100 | #124 | Exceptional $45,836 |
| Zimbabweans | 91.7 /100 | #125 | Exceptional $45,804 |
| Palestinians | 91.6 /100 | #126 | Exceptional $45,790 |
| Immigrants | Germany | 91.3 /100 | #127 | Exceptional $45,751 |
| Swedes | 91.3 /100 | #128 | Exceptional $45,750 |
| Luxembourgers | 90.4 /100 | #129 | Exceptional $45,663 |
| Arabs | 90.4 /100 | #130 | Exceptional $45,662 |
| Immigrants | North Macedonia | 90.0 /100 | #131 | Exceptional $45,622 |
| Jordanians | 89.9 /100 | #132 | Excellent $45,605 |
| Pakistanis | 89.7 /100 | #133 | Excellent $45,587 |
| Slovenes | 89.6 /100 | #134 | Excellent $45,581 |
| Hungarians | 87.9 /100 | #135 | Excellent $45,426 |
| Immigrants | Oceania | 85.2 /100 | #136 | Excellent $45,220 |
| Immigrants | Syria | 85.2 /100 | #137 | Excellent $45,218 |
| Assyrians/Chaldeans/Syriacs | 84.8 /100 | #138 | Excellent $45,195 |
Demographics Similar to Immigrants from Iraq by Per Capita Income
In terms of per capita income, the demographic groups most similar to Immigrants from Iraq are Immigrants from Cameroon ($41,334, a difference of 0.070%), Immigrants from St. Vincent and the Grenadines ($41,270, a difference of 0.23%), Immigrants from Barbados ($41,478, a difference of 0.27%), Immigrants from Trinidad and Tobago ($41,476, a difference of 0.27%), and Puget Sound Salish ($41,495, a difference of 0.31%).
| Demographics | Rating | Rank | Per Capita Income |
| Sudanese | 9.9 /100 | #215 | Tragic $41,695 |
| Tongans | 9.9 /100 | #216 | Tragic $41,693 |
| Guamanians/Chamorros | 9.7 /100 | #217 | Tragic $41,678 |
| Trinidadians and Tobagonians | 9.5 /100 | #218 | Tragic $41,655 |
| Puget Sound Salish | 8.1 /100 | #219 | Tragic $41,495 |
| Immigrants | Barbados | 7.9 /100 | #220 | Tragic $41,478 |
| Immigrants | Trinidad and Tobago | 7.9 /100 | #221 | Tragic $41,476 |
| Immigrants | Iraq | 7.1 /100 | #222 | Tragic $41,365 |
| Immigrants | Cameroon | 6.8 /100 | #223 | Tragic $41,334 |
| Immigrants | St. Vincent and the Grenadines | 6.4 /100 | #224 | Tragic $41,270 |
| West Indians | 6.0 /100 | #225 | Tragic $41,217 |
| Immigrants | Ecuador | 5.9 /100 | #226 | Tragic $41,195 |
| Immigrants | Ghana | 5.5 /100 | #227 | Tragic $41,131 |
| Immigrants | Grenada | 5.5 /100 | #228 | Tragic $41,123 |
| Nigerians | 4.9 /100 | #229 | Tragic $41,026 |