Immigrants from North America vs Yup'ik Unemployment Among Ages 55 to 59 years
COMPARE
Immigrants from North America
Yup'ik
Unemployment Among Ages 55 to 59 years
Unemployment Among Ages 55 to 59 years Comparison
Immigrants from North America
Yup'ik
4.7%
UNEMPLOYMENT AMONG AGES 55 TO 59 YEARS
93.9/ 100
METRIC RATING
105th/ 347
METRIC RANK
13.9%
UNEMPLOYMENT AMONG AGES 55 TO 59 YEARS
0.0/ 100
METRIC RATING
347th/ 347
METRIC RANK
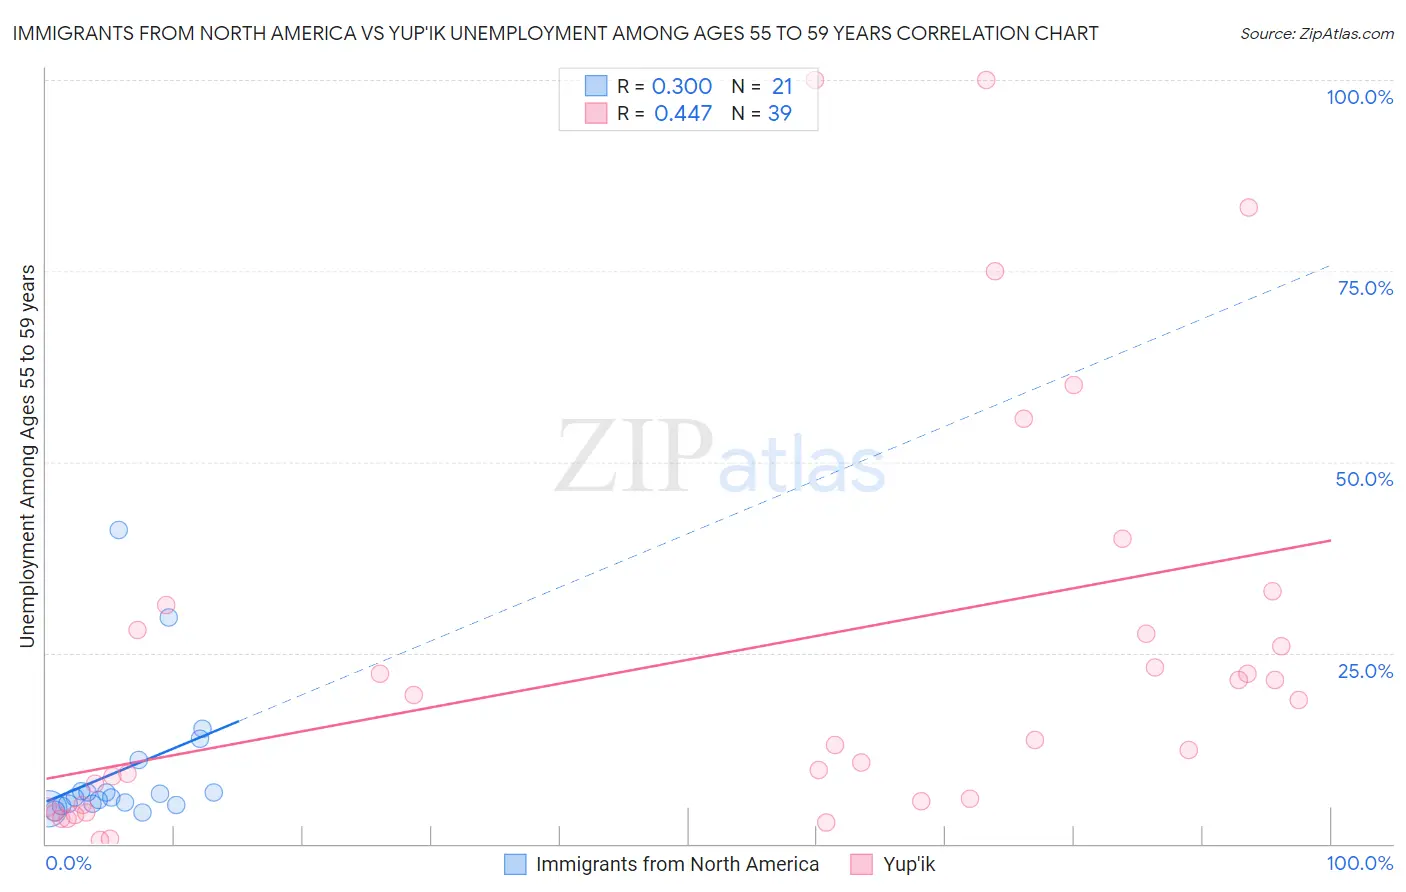
Immigrants from North America vs Yup'ik Unemployment Among Ages 55 to 59 years Correlation Chart
The statistical analysis conducted on geographies consisting of 420,202,803 people shows a mild positive correlation between the proportion of Immigrants from North America and unemployment rate among population between the ages 55 and 59 in the United States with a correlation coefficient (R) of 0.300 and weighted average of 4.7%. Similarly, the statistical analysis conducted on geographies consisting of 39,073,104 people shows a moderate positive correlation between the proportion of Yup'ik and unemployment rate among population between the ages 55 and 59 in the United States with a correlation coefficient (R) of 0.447 and weighted average of 13.9%, a difference of 197.5%.
Unemployment Among Ages 55 to 59 years Correlation Summary
| Measurement | Immigrants from North America | Yup'ik |
| Minimum | 4.1% | 0.49% |
| Maximum | 41.1% | 100.0% |
| Range | 37.0% | 99.5% |
| Mean | 9.6% | 24.0% |
| Median | 6.1% | 13.6% |
| Interquartile 25% (IQ1) | 5.2% | 5.0% |
| Interquartile 75% (IQ3) | 9.0% | 28.0% |
| Interquartile Range (IQR) | 3.8% | 23.0% |
| Standard Deviation (Sample) | 9.2% | 26.6% |
| Standard Deviation (Population) | 9.0% | 26.3% |
Similar Demographics by Unemployment Among Ages 55 to 59 years
Demographics Similar to Immigrants from North America by Unemployment Among Ages 55 to 59 years
In terms of unemployment among ages 55 to 59 years, the demographic groups most similar to Immigrants from North America are Immigrants from Turkey (4.7%, a difference of 0.010%), Immigrants from Laos (4.7%, a difference of 0.010%), Canadian (4.7%, a difference of 0.030%), Immigrants from Oceania (4.7%, a difference of 0.030%), and Immigrants from Egypt (4.7%, a difference of 0.070%).
| Demographics | Rating | Rank | Unemployment Among Ages 55 to 59 years |
| Immigrants | Germany | 94.8 /100 | #98 | Exceptional 4.7% |
| Yugoslavians | 94.7 /100 | #99 | Exceptional 4.7% |
| Serbians | 94.4 /100 | #100 | Exceptional 4.7% |
| Celtics | 94.3 /100 | #101 | Exceptional 4.7% |
| Canadians | 94.1 /100 | #102 | Exceptional 4.7% |
| Immigrants | Oceania | 94.0 /100 | #103 | Exceptional 4.7% |
| Immigrants | Turkey | 93.9 /100 | #104 | Exceptional 4.7% |
| Immigrants | North America | 93.9 /100 | #105 | Exceptional 4.7% |
| Immigrants | Laos | 93.9 /100 | #106 | Exceptional 4.7% |
| Immigrants | Egypt | 93.5 /100 | #107 | Exceptional 4.7% |
| French | 93.3 /100 | #108 | Exceptional 4.7% |
| Chileans | 93.2 /100 | #109 | Exceptional 4.7% |
| Egyptians | 92.9 /100 | #110 | Exceptional 4.7% |
| Austrians | 92.4 /100 | #111 | Exceptional 4.7% |
| Afghans | 92.1 /100 | #112 | Exceptional 4.7% |
Demographics Similar to Yup'ik by Unemployment Among Ages 55 to 59 years
In terms of unemployment among ages 55 to 59 years, the demographic groups most similar to Yup'ik are Menominee (10.5%, a difference of 32.2%), Tohono O'odham (9.3%, a difference of 49.6%), Inupiat (9.0%, a difference of 54.2%), Yakama (8.9%, a difference of 56.0%), and Hopi (8.1%, a difference of 71.6%).
| Demographics | Rating | Rank | Unemployment Among Ages 55 to 59 years |
| Pima | 0.0 /100 | #333 | Tragic 6.6% |
| Pueblo | 0.0 /100 | #334 | Tragic 6.7% |
| Colville | 0.0 /100 | #335 | Tragic 6.7% |
| Navajo | 0.0 /100 | #336 | Tragic 6.7% |
| Paiute | 0.0 /100 | #337 | Tragic 6.8% |
| Immigrants | Yemen | 0.0 /100 | #338 | Tragic 6.9% |
| Puerto Ricans | 0.0 /100 | #339 | Tragic 7.0% |
| Alaskan Athabascans | 0.0 /100 | #340 | Tragic 7.1% |
| Shoshone | 0.0 /100 | #341 | Tragic 7.4% |
| Hopi | 0.0 /100 | #342 | Tragic 8.1% |
| Yakama | 0.0 /100 | #343 | Tragic 8.9% |
| Inupiat | 0.0 /100 | #344 | Tragic 9.0% |
| Tohono O'odham | 0.0 /100 | #345 | Tragic 9.3% |
| Menominee | 0.0 /100 | #346 | Tragic 10.5% |
| Yup'ik | 0.0 /100 | #347 | Tragic 13.9% |