Immigrants from Honduras vs Senegalese Median Female Earnings
COMPARE
Immigrants from Honduras
Senegalese
Median Female Earnings
Median Female Earnings Comparison
Immigrants from Honduras
Senegalese
$34,647
MEDIAN FEMALE EARNINGS
0.0/ 100
METRIC RATING
320th/ 347
METRIC RANK
$39,384
MEDIAN FEMALE EARNINGS
34.2/ 100
METRIC RATING
189th/ 347
METRIC RANK
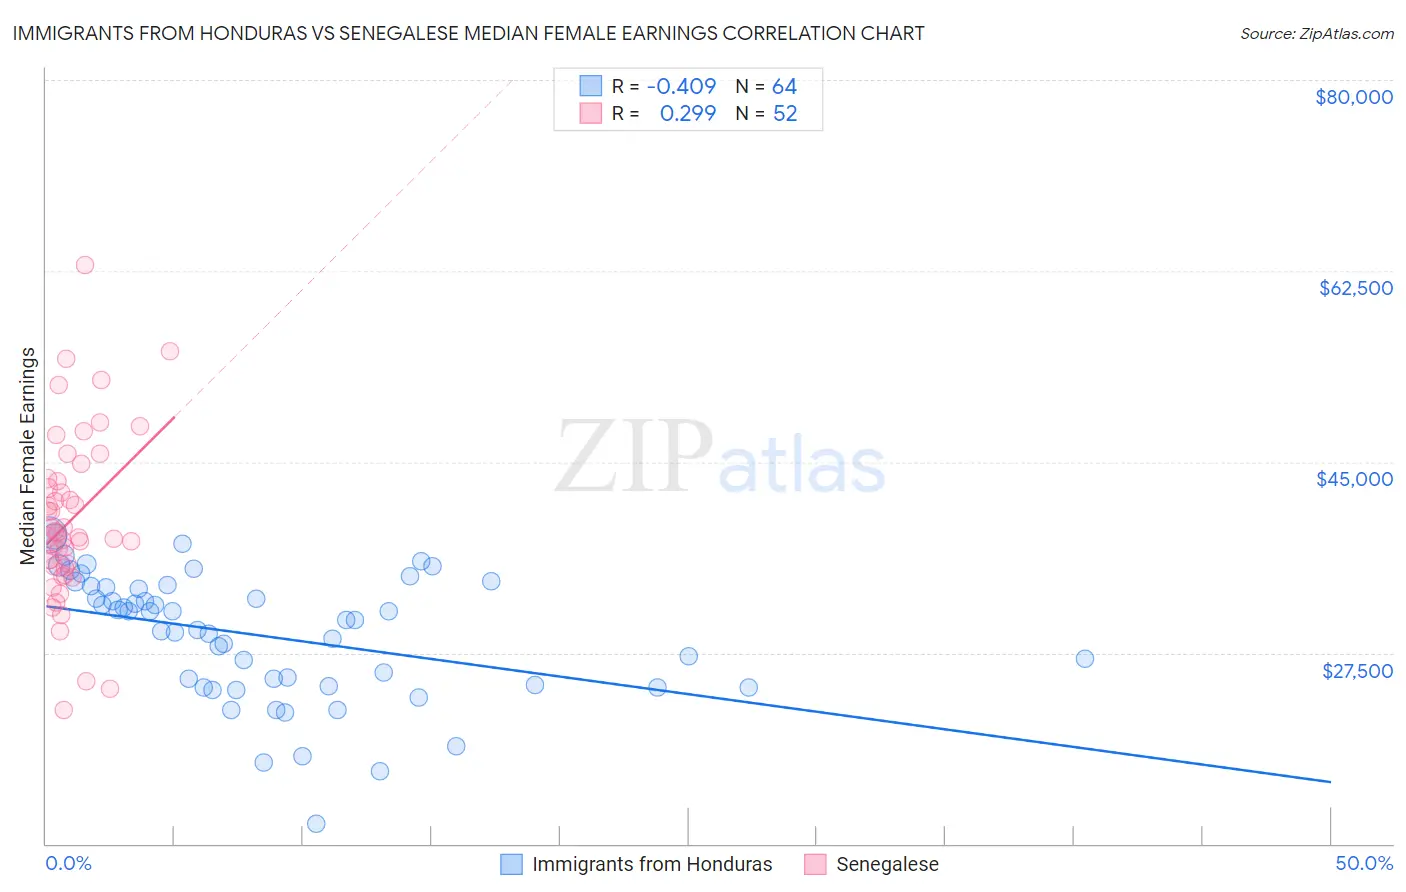
Immigrants from Honduras vs Senegalese Median Female Earnings Correlation Chart
The statistical analysis conducted on geographies consisting of 322,483,540 people shows a moderate negative correlation between the proportion of Immigrants from Honduras and median female earnings in the United States with a correlation coefficient (R) of -0.409 and weighted average of $34,647. Similarly, the statistical analysis conducted on geographies consisting of 78,104,317 people shows a weak positive correlation between the proportion of Senegalese and median female earnings in the United States with a correlation coefficient (R) of 0.299 and weighted average of $39,384, a difference of 13.7%.
Median Female Earnings Correlation Summary
| Measurement | Immigrants from Honduras | Senegalese |
| Minimum | $11,806 | $22,259 |
| Maximum | $38,285 | $63,050 |
| Range | $26,479 | $40,791 |
| Mean | $29,050 | $39,635 |
| Median | $30,512 | $38,318 |
| Interquartile 25% (IQ1) | $24,494 | $35,367 |
| Interquartile 75% (IQ3) | $33,580 | $43,341 |
| Interquartile Range (IQR) | $9,087 | $7,973 |
| Standard Deviation (Sample) | $5,773 | $7,802 |
| Standard Deviation (Population) | $5,727 | $7,727 |
Similar Demographics by Median Female Earnings
Demographics Similar to Immigrants from Honduras by Median Female Earnings
In terms of median female earnings, the demographic groups most similar to Immigrants from Honduras are Shoshone ($34,677, a difference of 0.090%), Immigrants from Yemen ($34,693, a difference of 0.13%), Cherokee ($34,742, a difference of 0.27%), Potawatomi ($34,739, a difference of 0.27%), and Pennsylvania German ($34,802, a difference of 0.45%).
| Demographics | Rating | Rank | Median Female Earnings |
| Cubans | 0.0 /100 | #313 | Tragic $34,942 |
| Apache | 0.0 /100 | #314 | Tragic $34,895 |
| Pennsylvania Germans | 0.0 /100 | #315 | Tragic $34,802 |
| Cherokee | 0.0 /100 | #316 | Tragic $34,742 |
| Potawatomi | 0.0 /100 | #317 | Tragic $34,739 |
| Immigrants | Yemen | 0.0 /100 | #318 | Tragic $34,693 |
| Shoshone | 0.0 /100 | #319 | Tragic $34,677 |
| Immigrants | Honduras | 0.0 /100 | #320 | Tragic $34,647 |
| Hispanics or Latinos | 0.0 /100 | #321 | Tragic $34,421 |
| Chickasaw | 0.0 /100 | #322 | Tragic $34,414 |
| Seminole | 0.0 /100 | #323 | Tragic $34,385 |
| Immigrants | Congo | 0.0 /100 | #324 | Tragic $34,317 |
| Dutch West Indians | 0.0 /100 | #325 | Tragic $34,106 |
| Kiowa | 0.0 /100 | #326 | Tragic $34,074 |
| Cajuns | 0.0 /100 | #327 | Tragic $34,034 |
Demographics Similar to Senegalese by Median Female Earnings
In terms of median female earnings, the demographic groups most similar to Senegalese are Puget Sound Salish ($39,376, a difference of 0.020%), Immigrants from Western Africa ($39,351, a difference of 0.080%), Swedish ($39,421, a difference of 0.090%), Bermudan ($39,418, a difference of 0.090%), and Immigrants from West Indies ($39,441, a difference of 0.14%).
| Demographics | Rating | Rank | Median Female Earnings |
| Tlingit-Haida | 40.5 /100 | #182 | Average $39,513 |
| Hungarians | 40.3 /100 | #183 | Average $39,510 |
| Europeans | 37.7 /100 | #184 | Fair $39,457 |
| Immigrants | West Indies | 36.9 /100 | #185 | Fair $39,441 |
| Colombians | 36.9 /100 | #186 | Fair $39,439 |
| Swedes | 36.0 /100 | #187 | Fair $39,421 |
| Bermudans | 35.9 /100 | #188 | Fair $39,418 |
| Senegalese | 34.2 /100 | #189 | Fair $39,384 |
| Puget Sound Salish | 33.9 /100 | #190 | Fair $39,376 |
| Immigrants | Western Africa | 32.7 /100 | #191 | Fair $39,351 |
| Immigrants | Immigrants | 31.7 /100 | #192 | Fair $39,328 |
| Immigrants | Nigeria | 30.2 /100 | #193 | Fair $39,294 |
| Irish | 30.0 /100 | #194 | Fair $39,291 |
| Uruguayans | 27.3 /100 | #195 | Fair $39,228 |
| Immigrants | Costa Rica | 25.6 /100 | #196 | Fair $39,186 |