Italian vs Senegalese Median Female Earnings
COMPARE
Italian
Senegalese
Median Female Earnings
Median Female Earnings Comparison
Italians
Senegalese
$41,505
MEDIAN FEMALE EARNINGS
97.7/ 100
METRIC RATING
105th/ 347
METRIC RANK
$39,384
MEDIAN FEMALE EARNINGS
34.2/ 100
METRIC RATING
189th/ 347
METRIC RANK
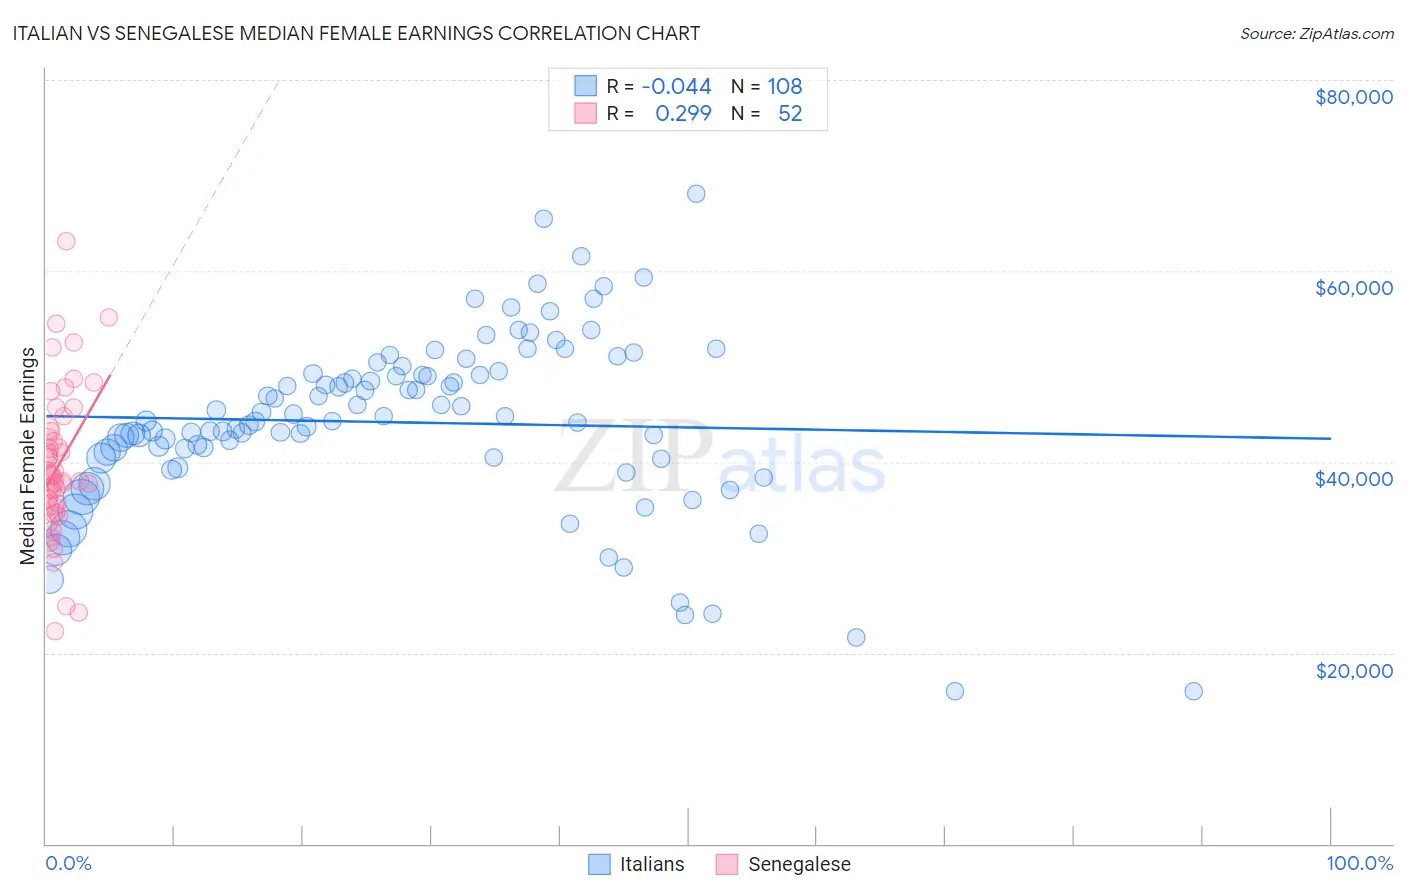
Italian vs Senegalese Median Female Earnings Correlation Chart
The statistical analysis conducted on geographies consisting of 573,135,086 people shows no correlation between the proportion of Italians and median female earnings in the United States with a correlation coefficient (R) of -0.044 and weighted average of $41,505. Similarly, the statistical analysis conducted on geographies consisting of 78,104,317 people shows a weak positive correlation between the proportion of Senegalese and median female earnings in the United States with a correlation coefficient (R) of 0.299 and weighted average of $39,384, a difference of 5.4%.
Median Female Earnings Correlation Summary
| Measurement | Italian | Senegalese |
| Minimum | $15,938 | $22,259 |
| Maximum | $68,125 | $63,050 |
| Range | $52,187 | $40,791 |
| Mean | $44,140 | $39,635 |
| Median | $44,292 | $38,318 |
| Interquartile 25% (IQ1) | $40,427 | $35,367 |
| Interquartile 75% (IQ3) | $49,180 | $43,341 |
| Interquartile Range (IQR) | $8,753 | $7,973 |
| Standard Deviation (Sample) | $9,271 | $7,802 |
| Standard Deviation (Population) | $9,228 | $7,727 |
Similar Demographics by Median Female Earnings
Demographics Similar to Italians by Median Female Earnings
In terms of median female earnings, the demographic groups most similar to Italians are Immigrants from Zimbabwe ($41,527, a difference of 0.050%), Immigrants from Eritrea ($41,485, a difference of 0.050%), Palestinian ($41,484, a difference of 0.050%), Jordanian ($41,464, a difference of 0.10%), and Chinese ($41,461, a difference of 0.10%).
| Demographics | Rating | Rank | Median Female Earnings |
| Immigrants | Scotland | 98.7 /100 | #98 | Exceptional $41,771 |
| Immigrants | Barbados | 98.4 /100 | #99 | Exceptional $41,685 |
| Romanians | 98.3 /100 | #100 | Exceptional $41,663 |
| Immigrants | Fiji | 98.3 /100 | #101 | Exceptional $41,656 |
| Immigrants | Poland | 98.2 /100 | #102 | Exceptional $41,630 |
| Immigrants | Argentina | 97.9 /100 | #103 | Exceptional $41,554 |
| Immigrants | Zimbabwe | 97.8 /100 | #104 | Exceptional $41,527 |
| Italians | 97.7 /100 | #105 | Exceptional $41,505 |
| Immigrants | Eritrea | 97.6 /100 | #106 | Exceptional $41,485 |
| Palestinians | 97.6 /100 | #107 | Exceptional $41,484 |
| Jordanians | 97.5 /100 | #108 | Exceptional $41,464 |
| Chinese | 97.5 /100 | #109 | Exceptional $41,461 |
| Immigrants | Western Asia | 97.0 /100 | #110 | Exceptional $41,375 |
| Immigrants | Canada | 97.0 /100 | #111 | Exceptional $41,373 |
| Immigrants | North America | 96.7 /100 | #112 | Exceptional $41,319 |
Demographics Similar to Senegalese by Median Female Earnings
In terms of median female earnings, the demographic groups most similar to Senegalese are Puget Sound Salish ($39,376, a difference of 0.020%), Immigrants from Western Africa ($39,351, a difference of 0.080%), Swedish ($39,421, a difference of 0.090%), Bermudan ($39,418, a difference of 0.090%), and Immigrants from West Indies ($39,441, a difference of 0.14%).
| Demographics | Rating | Rank | Median Female Earnings |
| Tlingit-Haida | 40.5 /100 | #182 | Average $39,513 |
| Hungarians | 40.3 /100 | #183 | Average $39,510 |
| Europeans | 37.7 /100 | #184 | Fair $39,457 |
| Immigrants | West Indies | 36.9 /100 | #185 | Fair $39,441 |
| Colombians | 36.9 /100 | #186 | Fair $39,439 |
| Swedes | 36.0 /100 | #187 | Fair $39,421 |
| Bermudans | 35.9 /100 | #188 | Fair $39,418 |
| Senegalese | 34.2 /100 | #189 | Fair $39,384 |
| Puget Sound Salish | 33.9 /100 | #190 | Fair $39,376 |
| Immigrants | Western Africa | 32.7 /100 | #191 | Fair $39,351 |
| Immigrants | Immigrants | 31.7 /100 | #192 | Fair $39,328 |
| Immigrants | Nigeria | 30.2 /100 | #193 | Fair $39,294 |
| Irish | 30.0 /100 | #194 | Fair $39,291 |
| Uruguayans | 27.3 /100 | #195 | Fair $39,228 |
| Immigrants | Costa Rica | 25.6 /100 | #196 | Fair $39,186 |