Crow vs Senegalese Median Female Earnings
COMPARE
Crow
Senegalese
Median Female Earnings
Median Female Earnings Comparison
Crow
Senegalese
$35,266
MEDIAN FEMALE EARNINGS
0.0/ 100
METRIC RATING
304th/ 347
METRIC RANK
$39,384
MEDIAN FEMALE EARNINGS
34.2/ 100
METRIC RATING
189th/ 347
METRIC RANK
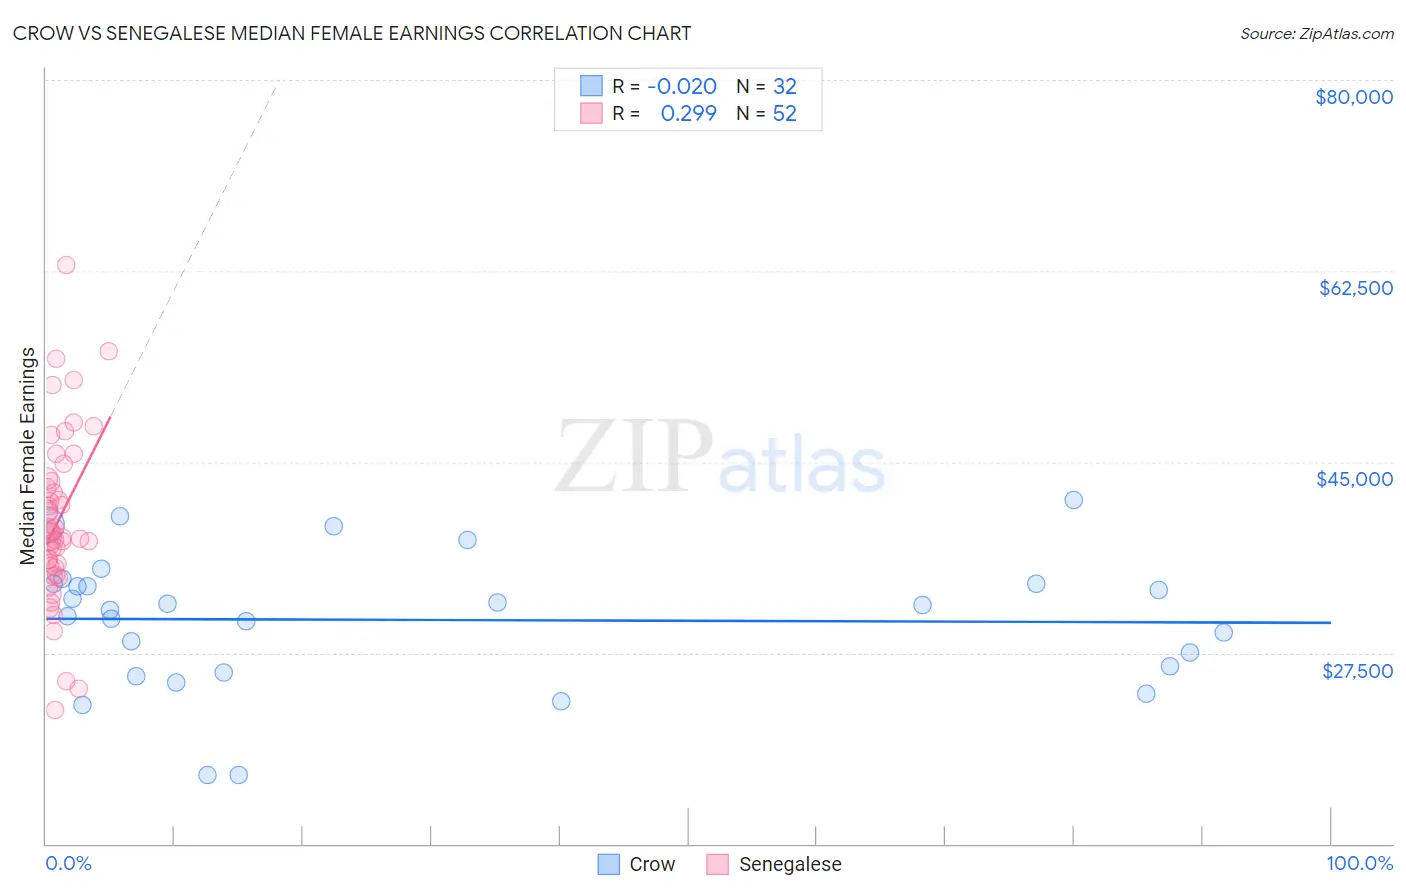
Crow vs Senegalese Median Female Earnings Correlation Chart
The statistical analysis conducted on geographies consisting of 59,190,197 people shows no correlation between the proportion of Crow and median female earnings in the United States with a correlation coefficient (R) of -0.020 and weighted average of $35,266. Similarly, the statistical analysis conducted on geographies consisting of 78,104,317 people shows a weak positive correlation between the proportion of Senegalese and median female earnings in the United States with a correlation coefficient (R) of 0.299 and weighted average of $39,384, a difference of 11.7%.
Median Female Earnings Correlation Summary
| Measurement | Crow | Senegalese |
| Minimum | $16,250 | $22,259 |
| Maximum | $41,563 | $63,050 |
| Range | $25,313 | $40,791 |
| Mean | $30,518 | $39,635 |
| Median | $31,642 | $38,318 |
| Interquartile 25% (IQ1) | $25,950 | $35,367 |
| Interquartile 75% (IQ3) | $33,807 | $43,341 |
| Interquartile Range (IQR) | $7,857 | $7,973 |
| Standard Deviation (Sample) | $6,205 | $7,802 |
| Standard Deviation (Population) | $6,108 | $7,727 |
Similar Demographics by Median Female Earnings
Demographics Similar to Crow by Median Female Earnings
In terms of median female earnings, the demographic groups most similar to Crow are Immigrants from Latin America ($35,307, a difference of 0.11%), Black/African American ($35,315, a difference of 0.14%), Pima ($35,326, a difference of 0.17%), Yuman ($35,377, a difference of 0.31%), and Bahamian ($35,125, a difference of 0.40%).
| Demographics | Rating | Rank | Median Female Earnings |
| Hmong | 0.0 /100 | #297 | Tragic $35,498 |
| Immigrants | Micronesia | 0.0 /100 | #298 | Tragic $35,477 |
| Immigrants | Guatemala | 0.0 /100 | #299 | Tragic $35,444 |
| Yuman | 0.0 /100 | #300 | Tragic $35,377 |
| Pima | 0.0 /100 | #301 | Tragic $35,326 |
| Blacks/African Americans | 0.0 /100 | #302 | Tragic $35,315 |
| Immigrants | Latin America | 0.0 /100 | #303 | Tragic $35,307 |
| Crow | 0.0 /100 | #304 | Tragic $35,266 |
| Bahamians | 0.0 /100 | #305 | Tragic $35,125 |
| Fijians | 0.0 /100 | #306 | Tragic $35,114 |
| Sioux | 0.0 /100 | #307 | Tragic $35,063 |
| Immigrants | Bahamas | 0.0 /100 | #308 | Tragic $35,027 |
| Hondurans | 0.0 /100 | #309 | Tragic $35,013 |
| Chippewa | 0.0 /100 | #310 | Tragic $35,003 |
| Ute | 0.0 /100 | #311 | Tragic $34,960 |
Demographics Similar to Senegalese by Median Female Earnings
In terms of median female earnings, the demographic groups most similar to Senegalese are Puget Sound Salish ($39,376, a difference of 0.020%), Immigrants from Western Africa ($39,351, a difference of 0.080%), Swedish ($39,421, a difference of 0.090%), Bermudan ($39,418, a difference of 0.090%), and Immigrants from West Indies ($39,441, a difference of 0.14%).
| Demographics | Rating | Rank | Median Female Earnings |
| Tlingit-Haida | 40.5 /100 | #182 | Average $39,513 |
| Hungarians | 40.3 /100 | #183 | Average $39,510 |
| Europeans | 37.7 /100 | #184 | Fair $39,457 |
| Immigrants | West Indies | 36.9 /100 | #185 | Fair $39,441 |
| Colombians | 36.9 /100 | #186 | Fair $39,439 |
| Swedes | 36.0 /100 | #187 | Fair $39,421 |
| Bermudans | 35.9 /100 | #188 | Fair $39,418 |
| Senegalese | 34.2 /100 | #189 | Fair $39,384 |
| Puget Sound Salish | 33.9 /100 | #190 | Fair $39,376 |
| Immigrants | Western Africa | 32.7 /100 | #191 | Fair $39,351 |
| Immigrants | Immigrants | 31.7 /100 | #192 | Fair $39,328 |
| Immigrants | Nigeria | 30.2 /100 | #193 | Fair $39,294 |
| Irish | 30.0 /100 | #194 | Fair $39,291 |
| Uruguayans | 27.3 /100 | #195 | Fair $39,228 |
| Immigrants | Costa Rica | 25.6 /100 | #196 | Fair $39,186 |