Immigrants from Nigeria vs Pakistani Householder Income Ages 25 - 44 years
COMPARE
Immigrants from Nigeria
Pakistani
Householder Income Ages 25 - 44 years
Householder Income Ages 25 - 44 years Comparison
Immigrants from Nigeria
Pakistanis
$86,589
HOUSEHOLDER INCOME AGES 25 - 44 YEARS
1.2/ 100
METRIC RATING
247th/ 347
METRIC RANK
$98,401
HOUSEHOLDER INCOME AGES 25 - 44 YEARS
89.3/ 100
METRIC RATING
125th/ 347
METRIC RANK
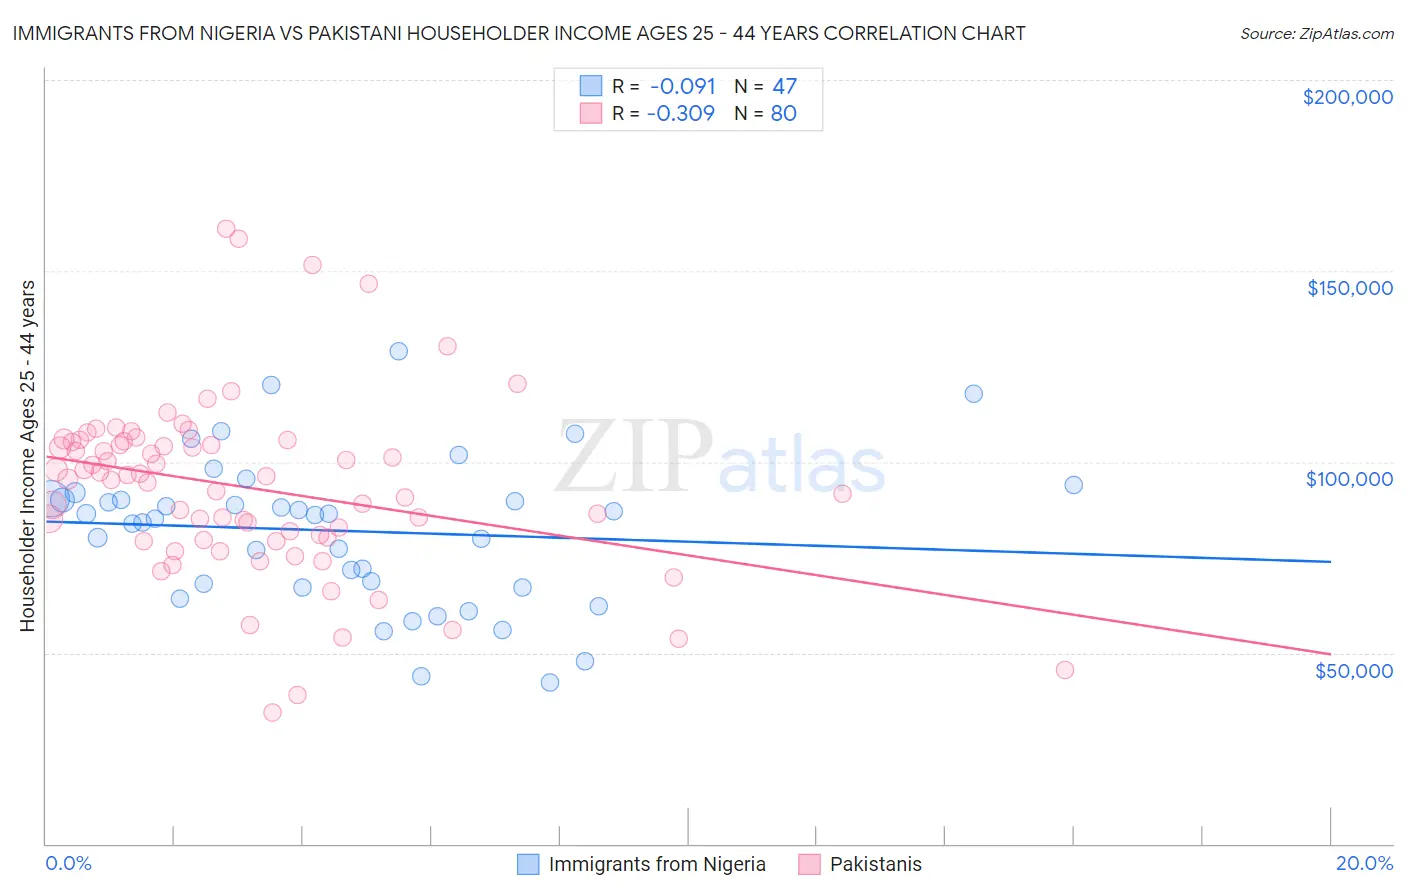
Immigrants from Nigeria vs Pakistani Householder Income Ages 25 - 44 years Correlation Chart
The statistical analysis conducted on geographies consisting of 283,094,597 people shows a slight negative correlation between the proportion of Immigrants from Nigeria and household income with householder between the ages 25 and 44 in the United States with a correlation coefficient (R) of -0.091 and weighted average of $86,589. Similarly, the statistical analysis conducted on geographies consisting of 334,652,075 people shows a mild negative correlation between the proportion of Pakistanis and household income with householder between the ages 25 and 44 in the United States with a correlation coefficient (R) of -0.309 and weighted average of $98,401, a difference of 13.6%.
Householder Income Ages 25 - 44 years Correlation Summary
| Measurement | Immigrants from Nigeria | Pakistani |
| Minimum | $42,092 | $34,363 |
| Maximum | $128,882 | $161,157 |
| Range | $86,790 | $126,794 |
| Mean | $81,924 | $93,256 |
| Median | $86,086 | $95,924 |
| Interquartile 25% (IQ1) | $67,086 | $79,748 |
| Interquartile 75% (IQ3) | $90,392 | $105,308 |
| Interquartile Range (IQR) | $23,305 | $25,561 |
| Standard Deviation (Sample) | $19,417 | $23,370 |
| Standard Deviation (Population) | $19,209 | $23,224 |
Similar Demographics by Householder Income Ages 25 - 44 years
Demographics Similar to Immigrants from Nigeria by Householder Income Ages 25 - 44 years
In terms of householder income ages 25 - 44 years, the demographic groups most similar to Immigrants from Nigeria are Immigrants from Burma/Myanmar ($86,736, a difference of 0.17%), Immigrants from El Salvador ($86,913, a difference of 0.37%), Immigrants from Venezuela ($87,038, a difference of 0.52%), Immigrants from West Indies ($87,063, a difference of 0.55%), and Immigrants from Sudan ($86,109, a difference of 0.56%).
| Demographics | Rating | Rank | Householder Income Ages 25 - 44 years |
| Nicaraguans | 2.2 /100 | #240 | Tragic $87,751 |
| Nigerians | 2.2 /100 | #241 | Tragic $87,730 |
| West Indians | 1.7 /100 | #242 | Tragic $87,205 |
| Immigrants | West Indies | 1.5 /100 | #243 | Tragic $87,063 |
| Immigrants | Venezuela | 1.5 /100 | #244 | Tragic $87,038 |
| Immigrants | El Salvador | 1.4 /100 | #245 | Tragic $86,913 |
| Immigrants | Burma/Myanmar | 1.3 /100 | #246 | Tragic $86,736 |
| Immigrants | Nigeria | 1.2 /100 | #247 | Tragic $86,589 |
| Immigrants | Sudan | 0.9 /100 | #248 | Tragic $86,109 |
| French American Indians | 0.8 /100 | #249 | Tragic $85,899 |
| Pennsylvania Germans | 0.8 /100 | #250 | Tragic $85,836 |
| Cape Verdeans | 0.8 /100 | #251 | Tragic $85,758 |
| Immigrants | Western Africa | 0.7 /100 | #252 | Tragic $85,676 |
| British West Indians | 0.7 /100 | #253 | Tragic $85,565 |
| Immigrants | Laos | 0.7 /100 | #254 | Tragic $85,553 |
Demographics Similar to Pakistanis by Householder Income Ages 25 - 44 years
In terms of householder income ages 25 - 44 years, the demographic groups most similar to Pakistanis are British ($98,359, a difference of 0.040%), Serbian ($98,320, a difference of 0.080%), European ($98,310, a difference of 0.090%), Brazilian ($98,267, a difference of 0.14%), and Zimbabwean ($98,586, a difference of 0.19%).
| Demographics | Rating | Rank | Householder Income Ages 25 - 44 years |
| Syrians | 92.9 /100 | #118 | Exceptional $99,215 |
| Jordanians | 92.8 /100 | #119 | Exceptional $99,186 |
| Swedes | 92.7 /100 | #120 | Exceptional $99,136 |
| Peruvians | 91.7 /100 | #121 | Exceptional $98,886 |
| Immigrants | Uzbekistan | 91.5 /100 | #122 | Exceptional $98,849 |
| Palestinians | 91.2 /100 | #123 | Exceptional $98,777 |
| Zimbabweans | 90.3 /100 | #124 | Exceptional $98,586 |
| Pakistanis | 89.3 /100 | #125 | Excellent $98,401 |
| British | 89.1 /100 | #126 | Excellent $98,359 |
| Serbians | 88.9 /100 | #127 | Excellent $98,320 |
| Europeans | 88.9 /100 | #128 | Excellent $98,310 |
| Brazilians | 88.6 /100 | #129 | Excellent $98,267 |
| Immigrants | Kuwait | 87.8 /100 | #130 | Excellent $98,122 |
| Immigrants | Albania | 86.6 /100 | #131 | Excellent $97,929 |
| Immigrants | Zimbabwe | 86.3 /100 | #132 | Excellent $97,880 |