Immigrants from Nigeria vs Alaska Native 2nd Grade

COMPARE

Immigrants from Nigeria
Race
Ancestry
AfghanAfricanAlaskan AthabascanAlbanianAleutAlsatianAmericanApacheArabArapahoArgentineanArmenianAssyrian/Chaldean/SyriacAustralianAustrianBahamianBangladeshiBarbadianBasqueBelgianBelizeanBermudanBhutaneseBlackfeetBolivianBrazilianBritishBritish West IndianBulgarianBurmeseCajunCambodianCanadianCape VerdeanCarpatho RusynCelticCentral AmericanCentral American IndianCherokeeCheyenneChickasawChileanChineseChippewaChoctawColombianColvilleComancheCosta RicanCreeCreekCroatianCrowCubanCypriotCzechCzechoslovakianDanishDelawareDominicanDutchDutch West IndianEastern EuropeanEcuadorianEgyptianEnglishEstonianEthiopianEuropeanFijianFilipinoFinnishFrenchFrench American IndianFrench CanadianGermanGerman RussianGhanaianGreekGuamanian/ChamorroGuatemalanGuyaneseHaitianHmongHonduranHopiHoumaHungarianIcelanderIndian (Asian)IndonesianInupiatIranianIraqiIrishIroquoisIsraeliItalianJamaicanJapaneseJordanianKenyanKiowaKoreanLaotianLatvianLebaneseLiberianLithuanianLumbeeLuxembourgerMacedonianMalaysianMalteseMarshalleseMenomineeMexicanMexican American IndianMongolianMoroccanNative HawaiianNavajoNepaleseNew ZealanderNicaraguanNigerianNorthern EuropeanNorwegianOkinawanOsageOttawaPaiutePakistaniPalestinianPanamanianParaguayanPennsylvania GermanPeruvianPimaPolishPortuguesePotawatomiPuebloPuerto RicanPuget Sound SalishRomanianRussianSalvadoranSamoanScandinavianScotch-IrishScottishSeminoleSenegaleseSerbianShoshoneSierra LeoneanSiouxSlavicSlovakSloveneSomaliSouth AfricanSouth AmericanSouth American IndianSoviet UnionSpaniardSpanishSpanish AmericanSpanish American IndianSri LankanSubsaharan AfricanSudaneseSwedishSwissSyrianTaiwaneseThaiTlingit-HaidaTohono O'OdhamTonganTrinidadian and TobagonianTsimshianTurkishU.S. Virgin IslanderUgandanUkrainianUruguayanUteVenezuelanVietnameseWelshWest IndianYakamaYaquiYugoslavianYumanYup'ikZimbabwean
Immigration
NonimmigrantsImmigrantsAfghanistanAfricaAlbaniaArgentinaArmeniaAsiaAustraliaAustriaBahamasBangladeshBarbadosBelarusBelgiumBelizeBoliviaBosnia and HerzegovinaBrazilBulgariaBurma/MyanmarCabo VerdeCambodiaCameroonCanadaCaribbeanCentral AmericaChileChinaColombiaCongoCosta RicaCroatiaCubaCzechoslovakiaDenmarkDominicaDominican RepublicEastern AfricaEastern AsiaEastern EuropeEcuadorEgyptEl SalvadorEnglandEritreaEthiopiaEuropeFijiFranceGermanyGhanaGreeceGrenadaGuatemalaGuyanaHaitiHondurasHong KongHungaryIndiaIndonesiaIranIraqIrelandIsraelItalyJamaicaJapanJordanKazakhstanKenyaKoreaKuwaitLaosLatin AmericaLatviaLebanonLiberiaLithuaniaMalaysiaMexicoMicronesiaMiddle AfricaMoldovaMoroccoNepalNetherlandsNicaraguaNigeriaNorth AmericaNorth MacedoniaNorthern AfricaNorthern EuropeNorwayOceaniaPakistanPanamaPeruPhilippinesPolandPortugalRomaniaRussiaSaudi ArabiaScotlandSenegalSerbiaSierra LeoneSingaporeSomaliaSouth AfricaSouth AmericaSouth Central AsiaSouth Eastern AsiaSouthern EuropeSpainSri LankaSt. Vincent and the GrenadinesSudanSwedenSwitzerlandSyriaTaiwanThailandTrinidad and TobagoTurkeyUgandaUkraineUruguayUzbekistanVenezuelaVietnamWest IndiesWestern AfricaWestern AsiaWestern EuropeYemenZaireZimbabweAzores
Alaska Native
Race
Ancestry
AfghanAfricanAlaska NativeAlaskan AthabascanAlbanianAleutAlsatianAmericanApacheArabArapahoArgentineanArmenianAssyrian/Chaldean/SyriacAustralianAustrianBahamianBangladeshiBarbadianBasqueBelgianBelizeanBermudanBhutaneseBlackfeetBolivianBrazilianBritishBritish West IndianBulgarianBurmeseCajunCambodianCanadianCape VerdeanCarpatho RusynCelticCentral AmericanCentral American IndianCherokeeCheyenneChickasawChileanChineseChippewaChoctawColombianColvilleComancheCosta RicanCreeCreekCroatianCrowCubanCypriotCzechCzechoslovakianDanishDelawareDominicanDutchDutch West IndianEastern EuropeanEcuadorianEgyptianEnglishEstonianEthiopianEuropeanFijianFilipinoFinnishFrenchFrench American IndianFrench CanadianGermanGerman RussianGhanaianGreekGuamanian/ChamorroGuatemalanGuyaneseHaitianHmongHonduranHopiHoumaHungarianIcelanderIndian (Asian)IndonesianInupiatIranianIraqiIrishIroquoisIsraeliItalianJamaicanJapaneseJordanianKenyanKiowaKoreanLaotianLatvianLebaneseLiberianLithuanianLumbeeLuxembourgerMacedonianMalaysianMalteseMarshalleseMenomineeMexicanMexican American IndianMongolianMoroccanNative HawaiianNavajoNepaleseNew ZealanderNicaraguanNigerianNorthern EuropeanNorwegianOkinawanOsageOttawaPaiutePakistaniPalestinianPanamanianParaguayanPennsylvania GermanPeruvianPimaPolishPortuguesePotawatomiPuebloPuerto RicanPuget Sound SalishRomanianRussianSalvadoranSamoanScandinavianScotch-IrishScottishSeminoleSenegaleseSerbianShoshoneSierra LeoneanSiouxSlavicSlovakSloveneSomaliSouth AfricanSouth AmericanSouth American IndianSoviet UnionSpaniardSpanishSpanish AmericanSpanish American IndianSri LankanSubsaharan AfricanSudaneseSwedishSwissSyrianTaiwaneseThaiTlingit-HaidaTohono O'OdhamTonganTrinidadian and TobagonianTsimshianTurkishU.S. Virgin IslanderUgandanUkrainianUruguayanUteVenezuelanVietnameseWelshWest IndianYakamaYaquiYugoslavianYumanYup'ikZimbabwean
Immigration
NonimmigrantsImmigrantsAfghanistanAfricaAlbaniaArgentinaArmeniaAsiaAustraliaAustriaBahamasBangladeshBarbadosBelarusBelgiumBelizeBoliviaBosnia and HerzegovinaBrazilBulgariaBurma/MyanmarCabo VerdeCambodiaCameroonCanadaCaribbeanCentral AmericaChileChinaColombiaCongoCosta RicaCroatiaCubaCzechoslovakiaDenmarkDominicaDominican RepublicEastern AfricaEastern AsiaEastern EuropeEcuadorEgyptEl SalvadorEnglandEritreaEthiopiaEuropeFijiFranceGermanyGhanaGreeceGrenadaGuatemalaGuyanaHaitiHondurasHong KongHungaryIndiaIndonesiaIranIraqIrelandIsraelItalyJamaicaJapanJordanKazakhstanKenyaKoreaKuwaitLaosLatin AmericaLatviaLebanonLiberiaLithuaniaMalaysiaMexicoMicronesiaMiddle AfricaMoldovaMoroccoNepalNetherlandsNicaraguaNorth AmericaNorth MacedoniaNorthern AfricaNorthern EuropeNorwayOceaniaPakistanPanamaPeruPhilippinesPolandPortugalRomaniaRussiaSaudi ArabiaScotlandSenegalSerbiaSierra LeoneSingaporeSomaliaSouth AfricaSouth AmericaSouth Central AsiaSouth Eastern AsiaSouthern EuropeSpainSri LankaSt. Vincent and the GrenadinesSudanSwedenSwitzerlandSyriaTaiwanThailandTrinidad and TobagoTurkeyUgandaUkraineUruguayUzbekistanVenezuelaVietnamWest IndiesWestern AfricaWestern AsiaWestern EuropeYemenZaireZimbabweAzores
2nd Grade
Income
Poverty
Unemployment
Labor Participation
Family Structure
Vehicle Availability
Education Level
Disability

2nd Grade Comparison

Immigrants from Nigeria

Alaska Natives

Tragic
Exceptional
97.4%
2ND GRADE
0.3/ 100
METRIC RATING
268th/ 347
METRIC RANK
98.7%
2ND GRADE
100.0/ 100
METRIC RATING
6th/ 347
METRIC RANK

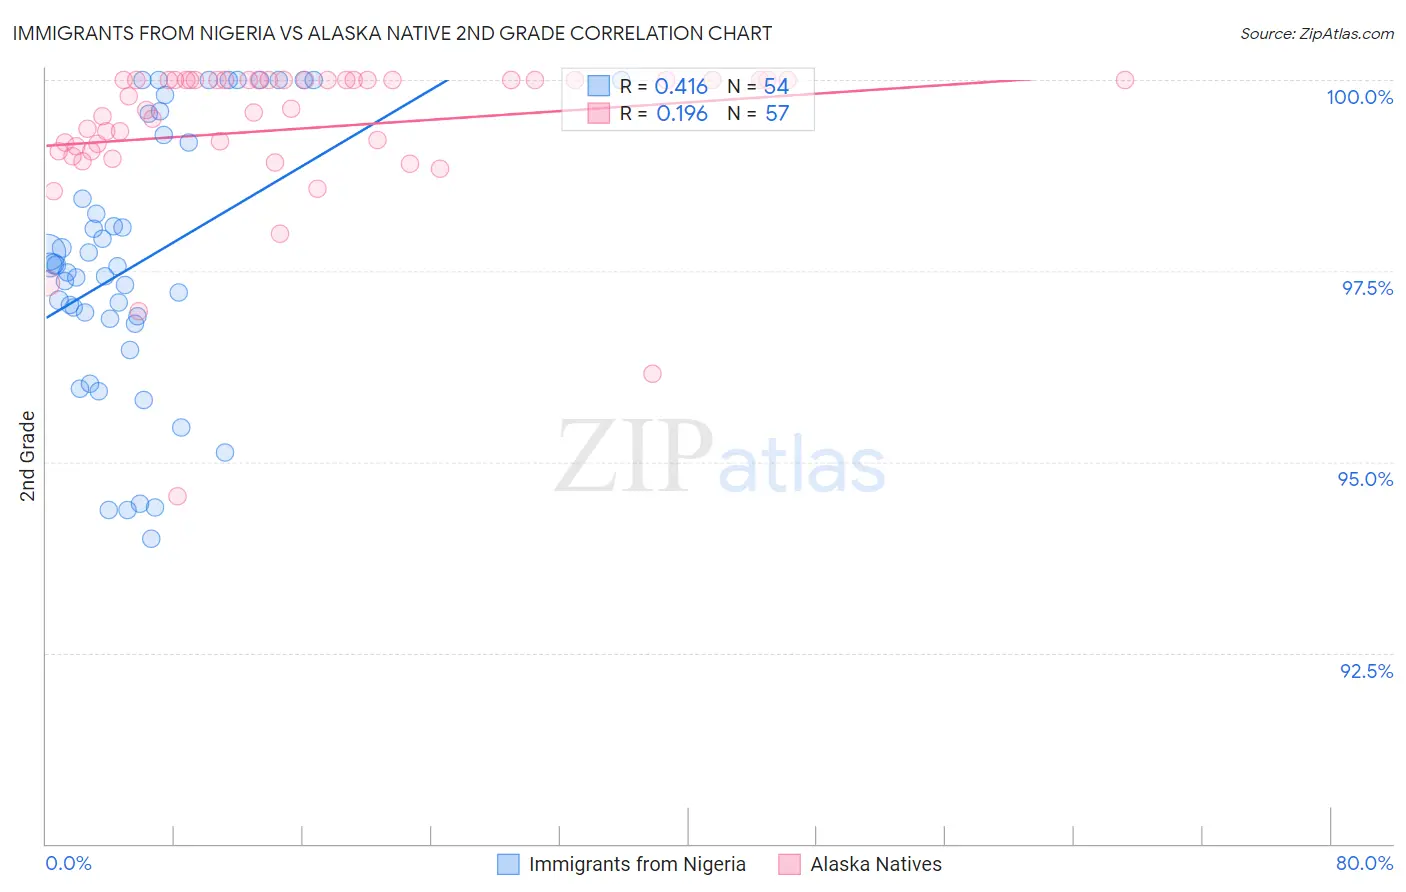
Immigrants from Nigeria vs Alaska Native 2nd Grade Correlation Chart

The statistical analysis conducted on geographies consisting of 283,430,369 people shows a moderate positive correlation between the proportion of Immigrants from Nigeria and percentage of population with at least 2nd grade education in the United States with a correlation coefficient (R) of 0.416 and weighted average of 97.4%. Similarly, the statistical analysis conducted on geographies consisting of 76,775,774 people shows a poor positive correlation between the proportion of Alaska Natives and percentage of population with at least 2nd grade education in the United States with a correlation coefficient (R) of 0.196 and weighted average of 98.7%, a difference of 1.3%.
Immigrants from Nigeria vs Alaska Native 2nd Grade

2nd Grade Correlation Summary

MeasurementImmigrants from NigeriaAlaska Native
Minimum94.0%94.6%
Maximum100.0%100.0%
Range6.0%5.4%
Mean97.6%99.4%
Median97.6%99.8%
Interquartile 25% (IQ1)96.9%99.1%
Interquartile 75% (IQ3)99.3%100.0%
Interquartile Range (IQR)2.4%0.93%
Standard Deviation (Sample)1.7%1.0%
Standard Deviation (Population)1.7%1.0%

Similar Demographics by 2nd Grade

Demographics Similar to Immigrants from Nigeria by 2nd Grade

In terms of 2nd grade, the demographic groups most similar to Immigrants from Nigeria are Cuban (97.4%, a difference of 0.0%), West Indian (97.4%, a difference of 0.0%), Immigrants from Liberia (97.4%, a difference of 0.020%), Immigrants from South America (97.4%, a difference of 0.020%), and Immigrants from Sierra Leone (97.4%, a difference of 0.020%).
DemographicsRating | Rank2nd Grade
Armenians
0.5
/100
|
#261
Tragic
97.5%
Taiwanese
0.4
/100
|
#262
Tragic
97.4%
Immigrants | Ethiopia
0.4
/100
|
#263
Tragic
97.4%
Immigrants | Liberia
0.4
/100
|
#264
Tragic
97.4%
Immigrants | South America
0.4
/100
|
#265
Tragic
97.4%
Immigrants | Sierra Leone
0.4
/100
|
#266
Tragic
97.4%
Cubans
0.3
/100
|
#267
Tragic
97.4%
Immigrants | Nigeria
0.3
/100
|
#268
Tragic
97.4%
West Indians
0.3
/100
|
#269
Tragic
97.4%
Immigrants | Jamaica
0.2
/100
|
#270
Tragic
97.4%
Immigrants | Cameroon
0.2
/100
|
#271
Tragic
97.4%
Immigrants | Peru
0.1
/100
|
#272
Tragic
97.4%
Immigrants | Bolivia
0.1
/100
|
#273
Tragic
97.4%
Ghanaians
0.1
/100
|
#274
Tragic
97.4%
Immigrants | China
0.1
/100
|
#275
Tragic
97.3%

Demographics Similar to Alaska Natives by 2nd Grade

In terms of 2nd grade, the demographic groups most similar to Alaska Natives are Norwegian (98.7%, a difference of 0.010%), German (98.7%, a difference of 0.030%), Slovak (98.7%, a difference of 0.030%), Alaskan Athabascan (98.7%, a difference of 0.040%), and Slovene (98.6%, a difference of 0.050%).
DemographicsRating | Rank2nd Grade
Crow
100.0
/100
|
#1
Exceptional
99.6%
Yup'ik
100.0
/100
|
#2
Exceptional
99.2%
Inupiat
100.0
/100
|
#3
Exceptional
98.8%
Tsimshian
100.0
/100
|
#4
Exceptional
98.8%
Alaskan Athabascans
100.0
/100
|
#5
Exceptional
98.7%
Alaska Natives
100.0
/100
|
#6
Exceptional
98.7%
Norwegians
100.0
/100
|
#7
Exceptional
98.7%
Germans
100.0
/100
|
#8
Exceptional
98.7%
Slovaks
100.0
/100
|
#9
Exceptional
98.7%
Slovenes
100.0
/100
|
#10
Exceptional
98.6%
Tlingit-Haida
100.0
/100
|
#11
Exceptional
98.6%
Carpatho Rusyns
100.0
/100
|
#12
Exceptional
98.6%
English
100.0
/100
|
#13
Exceptional
98.6%
Swedes
100.0
/100
|
#14
Exceptional
98.6%
Scottish
100.0
/100
|
#15
Exceptional
98.6%